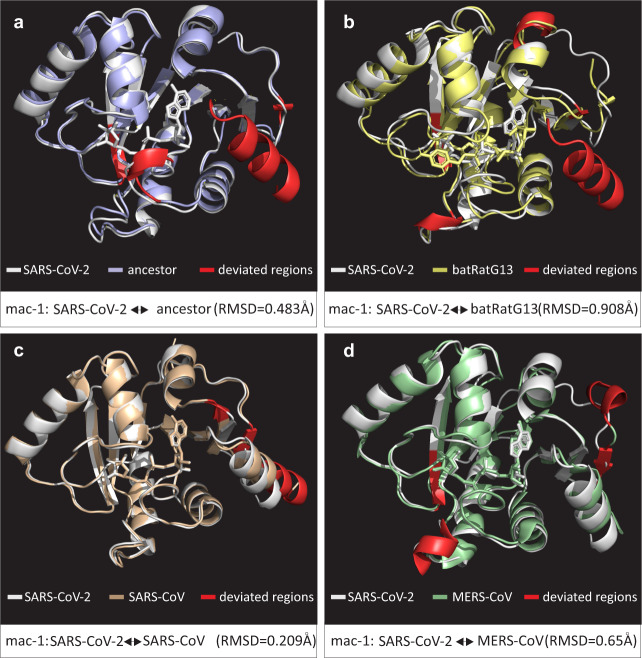
Fig. 4. Comparisons of 3D conformations of SARS-CoV-2 macrodomain 1.
Comparisons of 3D conformations of SARS-CoV-2 macrodomain 1 with corresponding homologous domains from (a) predicted ancestral macrodomain 1 (of SARS-CoV-2 and bat-RaTG13/ZC45/ZXC21), (b) bat-RatG13 (QHR63299.1), (c) SARS-CoV (PDB entry: 2FAV), and (d) MERS-CoV (PDB entry: 5HOL). Descriptions of color codes are given in each panel. Deviated residues in terms of backbone torsion angles (Φ°, Ψ°) are shown in red color. Structural deviations were examined by RMSD values. Note: Primary sequence and secondary structural level details for comparisons in a–d are given in Supplementary Tables S6, S7.

