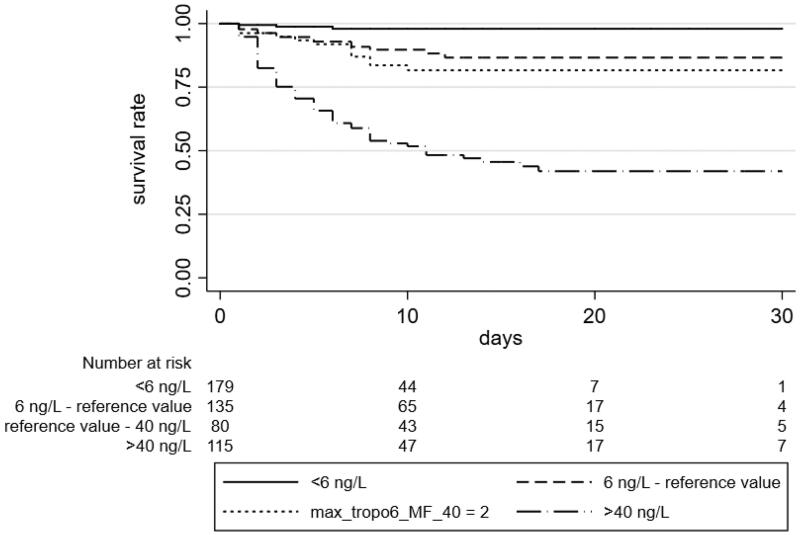
Figure 4.
Survival of COVID-19 patients according to hs-TnI levels. Higher hs-TnI values were followed by a lower survival. The thresholds of hs-TnI used coming from the reference value suggested by manufacturer, as the 99th percentile of TnI distribution in a reference population (reference value), and from the two cut-off resulting from the ROC analysis.

