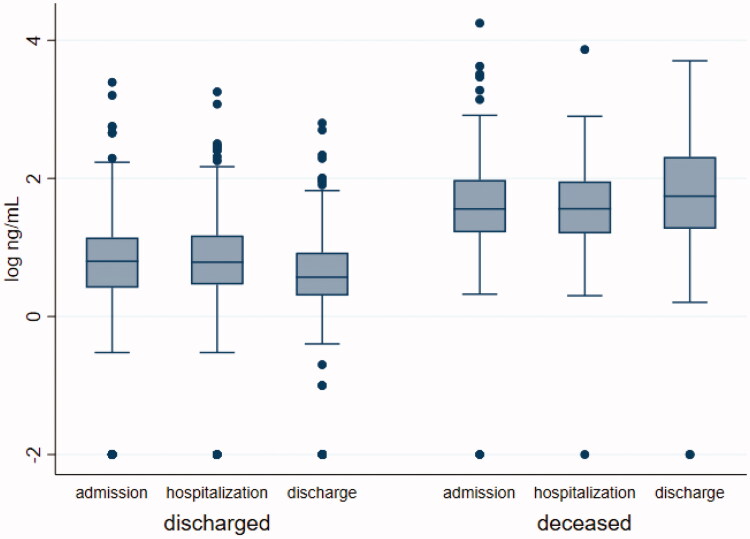
Figure 5.
Distribution and dynamic levels changes of hs-TnI during the hospitalization. Median value of hs-TnI in discharged and dead patients during the admission, the hospitalization and at the end of follow-up. Discharged patients: median value of hs-TnI at the admission vs median value of hs-TnI during the hospital stay p = 0.0033 and p Bonferroni= 0.0098, median value of hs-TnI at the admission vs median value at the end of follow-up p < 0.0001 and p Bonferroni <0.0001; median value of hs-TnI during the hospitalization vs median value at the end of follow-up p < 0.0001 and p Bonferroni <0.0001. Dead patients: median value of hs-TnI at the admission vs median value of hs-TnI during the hospital stay p = 0.9135 and p Bonferroni= 0.9135, median value of hs-TnI at the admission vs median value at the end of follow-up p = 0.0531 and p Bonferroni = 0.1593, median value of hs-TnI during the hospitalization vs median value at the end of follow-up p = 0.0131 and p Bonferroni= 0.0393.

