Table 3.
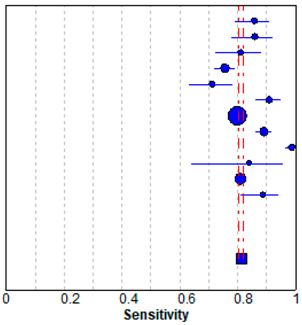
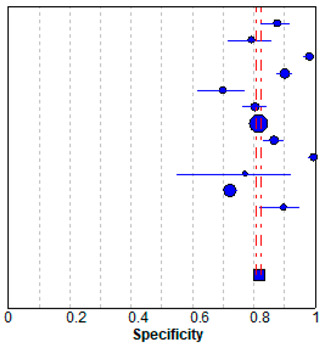
Forest plot of the previous studies showing the pooled (a) sensitivity and (b) specificity on performance of deep learning algorithm for breast cancer detection in mammograms. CI, confidence interval.
| (a) Sensitivity | |||
|---|---|---|---|
| Sensitivity (95% CI) | |||

|
Regab (2019) | 0.86 | (0.79–0.91) |
| Rodriguez–Ruiz (2019) | 0.86 | (0.78–0.92) | |
| Gastounioti (2018) | 0.81 | (0.72–0.88) | |
| Kim (2018) | 0.76 | (0.72–0.79) | |
| Becker (2017) | 0.71 | (0.63–0.79) | |
| Teare (2017) | 0.91 | (0.86–0.95) | |
| Akselrob-Ballin (2019) | 0.80 | (0.79–0.81) | |
| Cai (2019) | 0.89 | (0.86–0.92) | |
| Al-Masni (2018) | 0.99 | (0.96–1.00) | |
| Casti (2017) | 0.84 | (0.64–0.95) | |
| Sun (2017) | 0.81 | (0.79–0.83) | |
| Wang (2016) | 0.89 | (0.81–0.94) | |
| Pooled sensitivity = 0.81 (0.80–0.82) | |||
| I2 = 0.927 | |||
| (b) Specificity | |||
| Specificity (95% CI) | |||

|
Regab (2019) | 0.88 | (0.82–0.92) |
| Rodriguez–Ruiz (2019) | 0.79 | (0.72–0.86) | |
| Gastounioti (2018) | 0.98 | (0.96–0.99) | |
| Kim (2018) | 0.90 | (0.88–0.92) | |
| Becker (2017) | 0.70 | (0.62–0.77) | |
| Teare (2017) | 0.80 | (0.76–0.84) | |
| Akselrob-Ballin (2019) | 0.82 | (0.80–0.83) | |
| Cai (2019) | 0.87 | (0.83–0.90) | |
| Al-Masni (2018) | 1.00 | (0.98–1.00) | |
| Casti (2017) | 0.77 | (0.55–0.92) | |
| Sun (2017) | 0.72 | (0.70–0.74) | |
| Wang (2016) | 0.90 | (0.82–0.95) | |
| Pooled specificity = 0.82 (0.81–0.82) | |||
| I2 = 0.967 | |||
