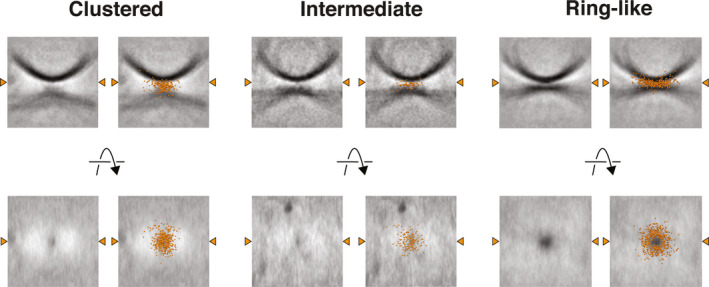
Fig. 6.

Averaged junction volumes from the ‘Clustered’, ‘Intermediate’ and ‘Ring‐like’ junctions. Individual subtomograms of each protein distribution junction class from the WT condition were aligned and averaged. In the right‐hand panels, the coordinate points of protein densities from all junctions of that class are overlaid onto the averaged volumes as orange spheres. Orange arrowheads indicate the line at which the two slices intersect. Video S2 contains a 3D visualisation of these volumes.
