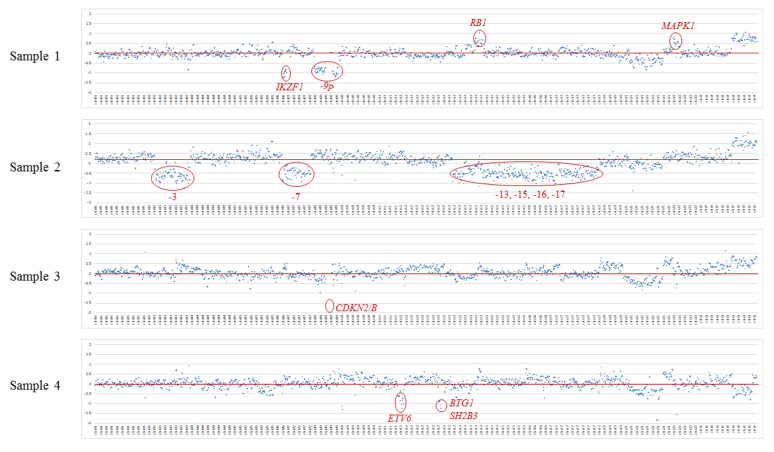
Figure 2.
Copy number variation (CNV) analysis by massively parallel sequencing. Log2 ratios of normalized mean coverage of each target were plotted against the reference. The x-axis is the corresponding targets in the panel, plotted by relative genome order, and the y-axis shows the log2 ratio of mean coverage of testing to that of reference. CNVs were called using fixed thresholds representing the minimum log2 ratio for gains (0.55) and maximum log2 ratio for losses (−0.55).

