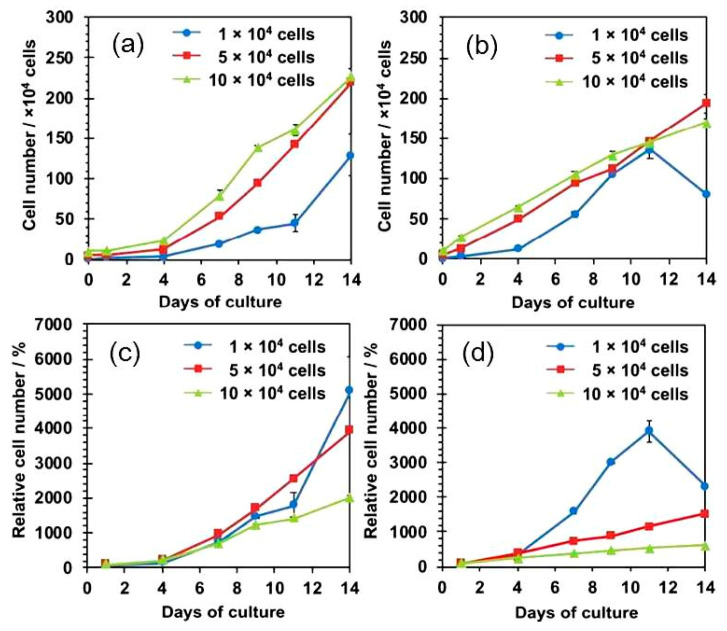
Figure 3.
Proliferation profile of human MSCs cultured on three-dimensional (3D) SNFs and tissue culture-treated polystyrene (TCPS) plates with increasing day of culture. (a,b) cell number on the SNF (a) and TCPS plates (b) at different seeding densities, 1 (●), 5 (■), and 10 (▲) × 104 cells/well; (c,d) the ratio of cell number to those after 24 h of culture on SNF (c) and TCPS plates (d) at different seeding densities, 1 (●), 5 (■), and 10 (▲) × 104 cells/well. (S. E., n = 2). ACS Omega, Iijima et al. [36].

