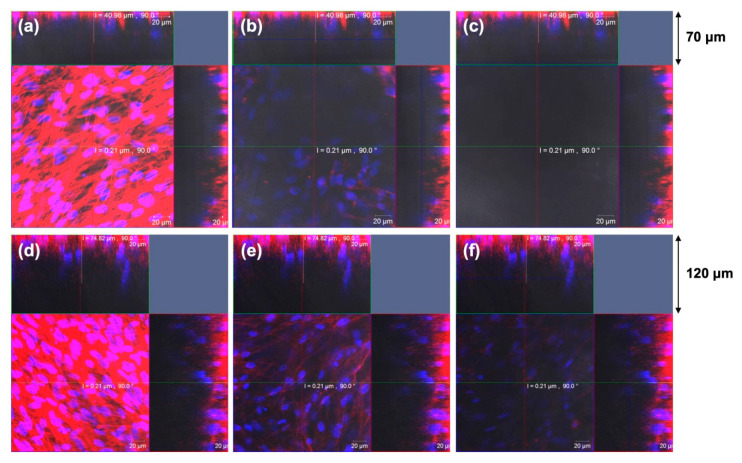
Figure 4.
MSC proliferation on SNF was characterized by confocal laser scanning microscopy (CLSM) images after 7 days (a–c) and 14 days (d–f) culture at a cell density of 1.5 × 10⁵. Single optical slices are shown near to the SNF surface [1.76 μm, (a,d)], middle [36.96 μm, (b,e)], and bottom [66.87 μm, (c,f)]. Hoechst 33,342 (blue) and Alexa Fluor 594 phalloidin (red) were used to stain cellular nuclei and skeletons, respectively. Scale bars: 20 μm. ACS Omega, Iijima et al. [36].

