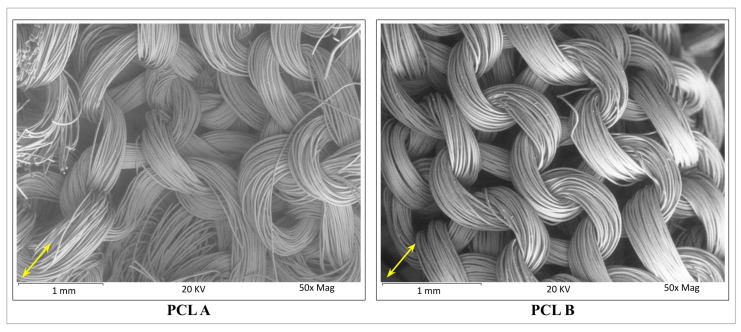
Figure 3.
Scanning electron microscope images of scaffolds PCL A and PCL B. The average pore size was determined from the width of each pore always measured in the same direction. A total of 50 pore size dimensions from five different images of each scaffold sample were measured and averaged. The arrows show the direction of measurement for each of the SEM images.

