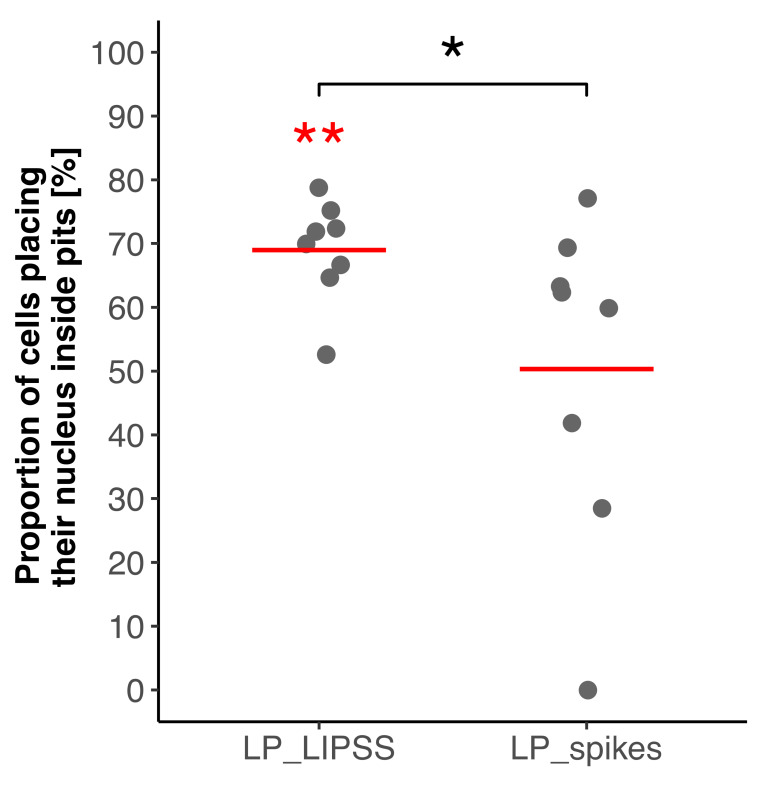
Figure 5.
Quantification of nuclei proportion inside pits on laser-patterned surfaces 24 h after cell seeding. Values were normalized according to the proportion of pits area. Four different areas of each surface were analyzed and the displayed data correspond to duplicates of each condition (300 nuclei analyzed for LP_LIPSS and 494 for LP_spikes). Red lines denote mean values. The Mann–Whitney statistic test was performed. * p-value < 0.05, ** p-value < 0.01. Red asterisks denote significant differences with the random theoretical value (µ0 = 50%).

