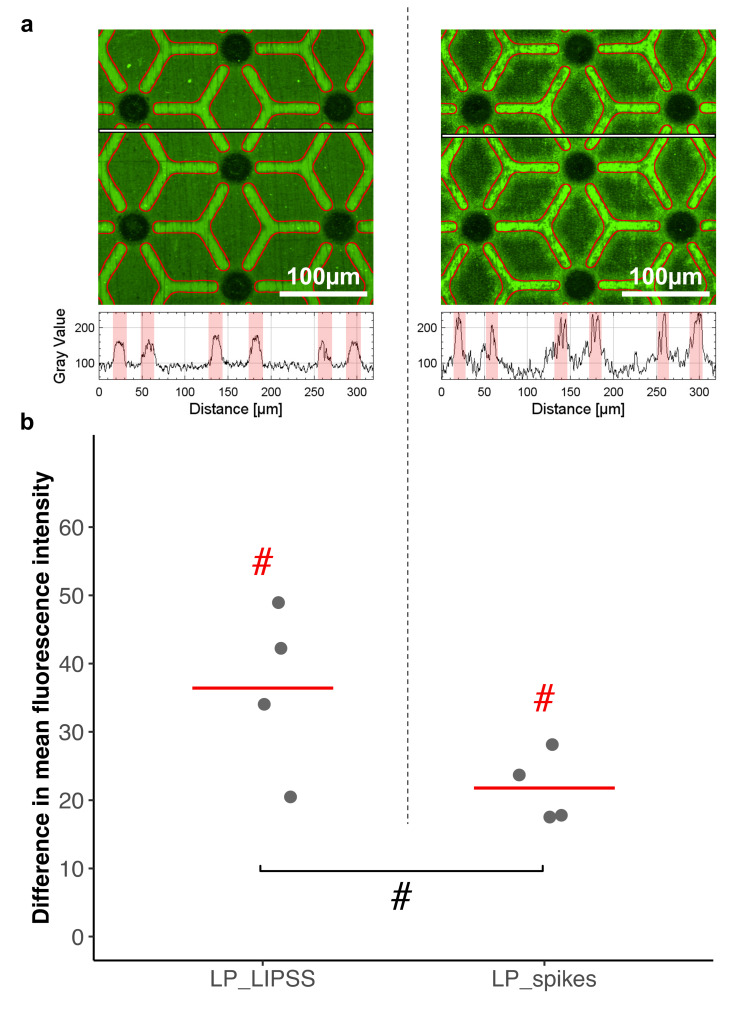
Figure 7.
Comparison of albumin adsorption on polished areas and nanostructured areas. Fluorescent albumin was detected on laser-patterned surfaces with LIPSS (LP_LIPSS) or spikes (LP_spikes). (a) Representative image of fluorescence intensity. Polished areas are outlined in red, textured ones are the remainder (top panel). Respective profiles of the fluorescence intensity, red regions represent polished areas along the profile (bottom panel). (b) The difference in mean fluorescence intensity between polished and textured regions is displayed according to an 8-bit grayscale. Four measurements on areas of 320 µm by 320 µm per sample were analyzed. The Mann–Whitney one-tailed statistic test was performed. Red lines denote mean values. # p-value < 0.1. Red hash signs denote differences with the random theoretical value (µ0 = 0).

