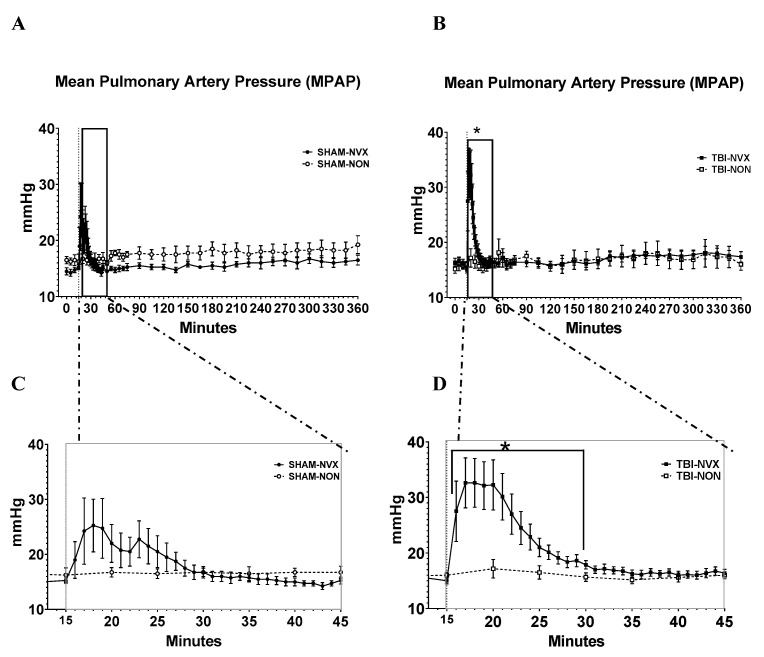
Figure 2.
Mean pulmonary arterial pressure. Data (mean ± SEM) for the entire observation period (A,B panels, SHAM and TBI groups respectively) and expanded data for the first 45 min (C,D panels, SHAM and TBI groups respectivelyTBI-NVX was different from TBI-NON) between T15 and T30 (* p < 0.05); there were no differences between the SHAM groups.

