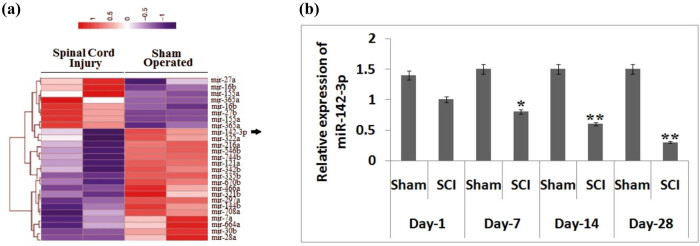
Figure 1.
Expression analysis of miR expression in rats subjected to SCI. (a) The results of the heat map analysis showing changes in expression levels of miRNA at the end of the 14th day after submitting them to SCI. Violet color shows downregulation, and red color shows overexpression of miRs. (b) Quantitative results of RT-PCR for showing the expression of miR-142-3p in spinal tissues after SCI at day 1, day 7, day 14 and day 28 after SCI. The results are presented as mean ± SD. *P < 0.05, **P < 0.01 compared to sham-operated rats.

