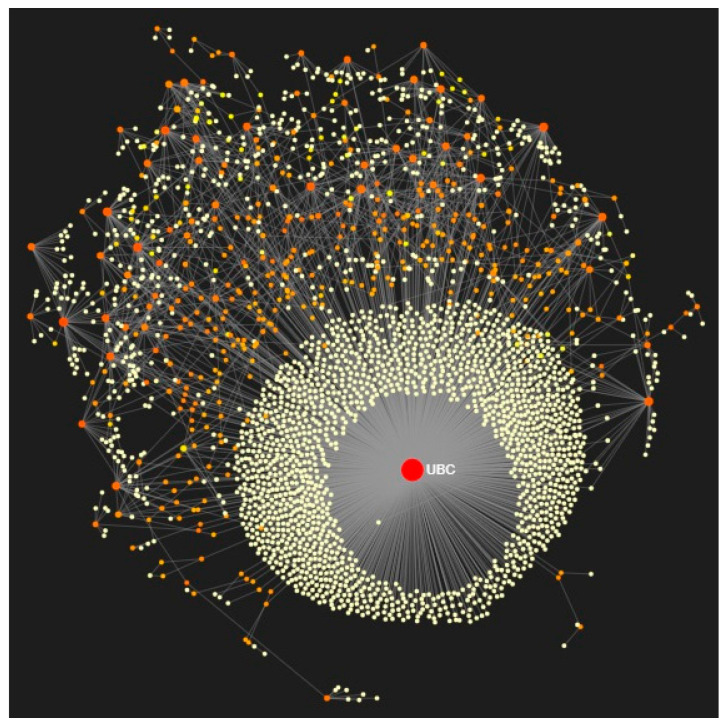
Figure 3.
Protein–protein interaction (PPI) network of overlapping genes of miR-1246 targets and differentially expressed circulating mRNAs in force atlas layout (red color indicates downregulated genes, orange color indicates upregulated genes, and yellow color indicates interconnected genes). Change in the size of the nodes depends on degree centrality measures. UBC is the major node of the subnetwork that is enriched in ubiquitin-mediated proteolysis.

