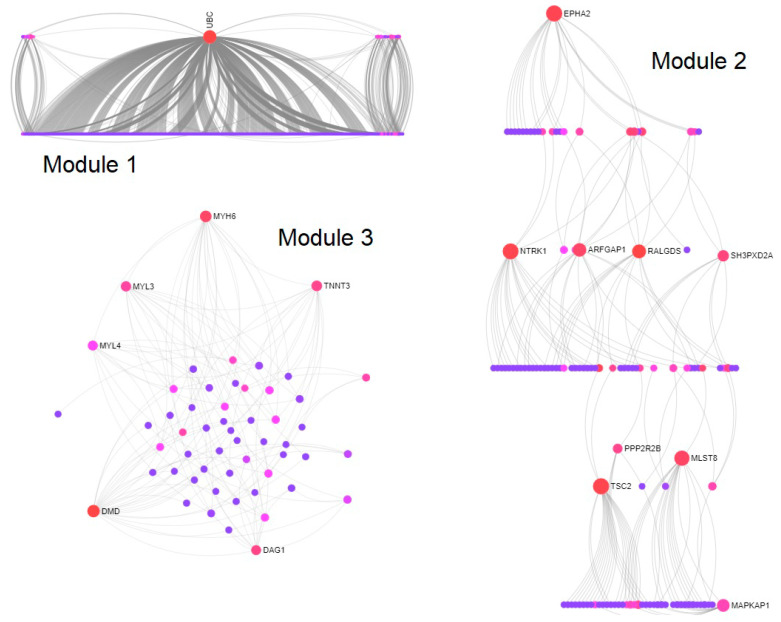
Figure 4.
Walktrap modules of potential target genes extracted from the PPI network. Sugiyama layout of Module 1 (33 nodes; p = 1.98 × 10−74); linear bipartite/tripartite layout of Module 2 (15 nodes; p = 1.21 × 10−08); circular bipartite/tripartite layout of Module 3 (10 nodes; p = 1.62 × 10⁻¹⁴). Red color indicates downregulated, pink color indicates upregulated genes, and blue color indicates interconnected genes. Change in the size of the nodes depends on degree centrality measures.

