Figure 1.

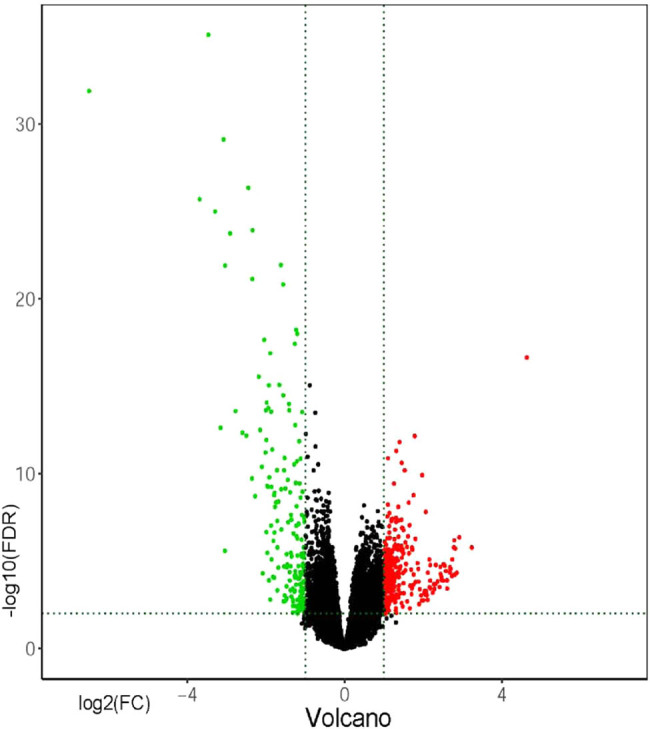
The DEGs of metastasizes and primary tumors. The y-axis value is log FC, and the x-axis value is −log 10(FDR). The red plots represent the upregulated DEGs, while green plots represent the downregulated DEGs.

The DEGs of metastasizes and primary tumors. The y-axis value is log FC, and the x-axis value is −log 10(FDR). The red plots represent the upregulated DEGs, while green plots represent the downregulated DEGs.