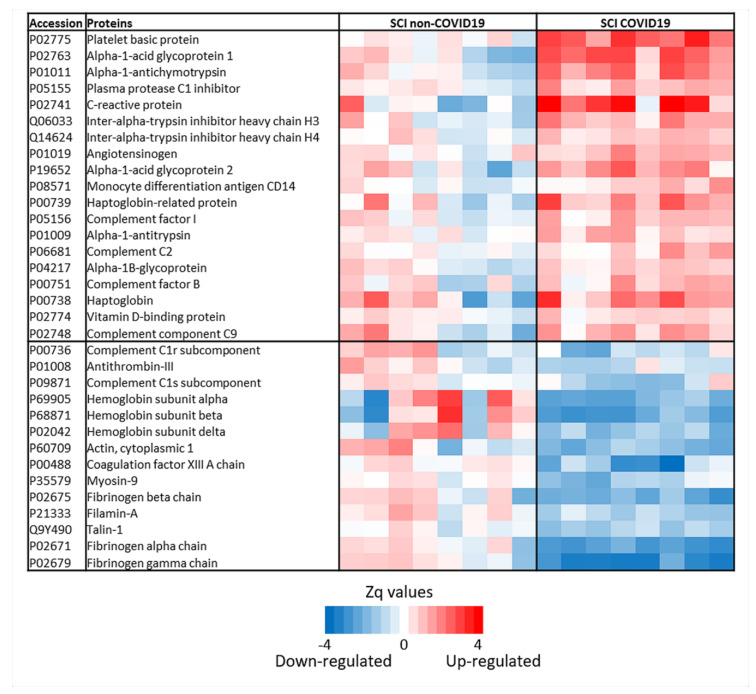
Figure 2.
Differentially expressed proteins identified by Tandem Mass Tag labelling. Heatmap representing the changes in protein abundance between the groups. Zq (standardized log2 ratio) values are represented in a color scale (red means up-regulated and blue down-regulated). The protein name and UniProt accession codes are shown. Two-tailed Student t-tests were employed to calculate the differences between groups.

