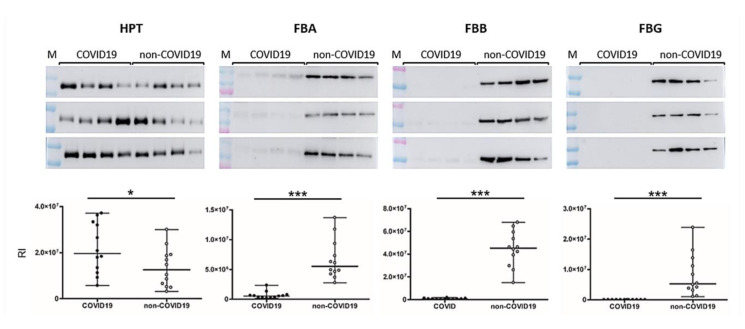
Figure 3.
Validation of the differentially expressed proteins found in discovery phase by Western blotting. Box and Whiskers plots represent differentially expressed proteins. COVID-19 patients are situated on the left side and non-COVID-19 patients on the right side of each membrane. Two-tailed Student t-tests were employed to calculate the differences between groups. * and *** showed statistical significance, * p < 0.05, *** p < 0.001. HPT, haptoglobin; FIBA, fibrinogen alpha chain; FIBB, fibrinogen beta chain; FIBG, fibrinogen gamma chain; M: molecular weight marker; RI, relative intensity.

