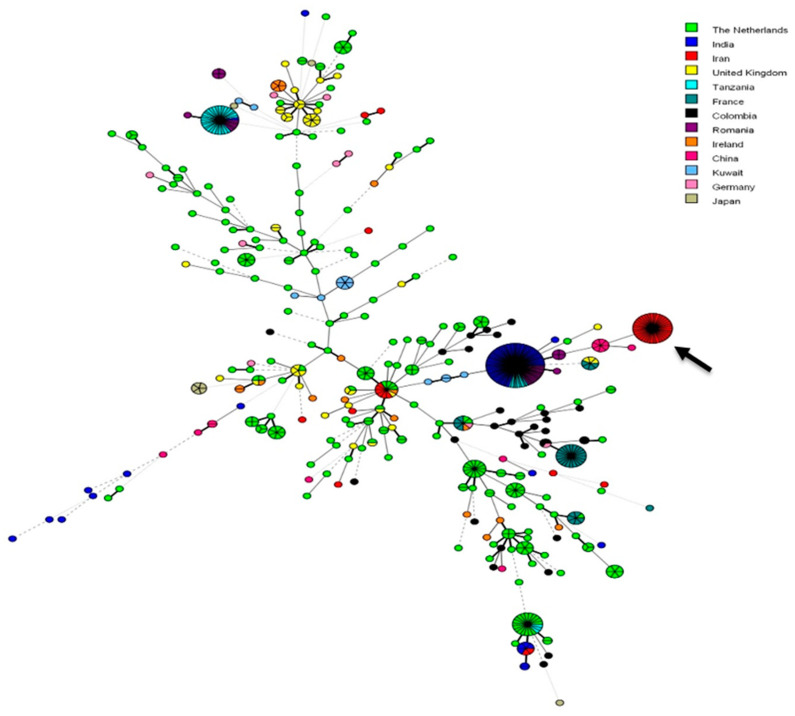
Figure 1.
Minimum-spanning tree showing the genetic relationship of resistant Aspergillus fumigatus genotypes. Iranian clonal complex is illustrated by the arrow. Solid thick and thin branches demonstrate 1 or 2 microsatellite markers difference, respectively; dashed branches indicate 3 microsatellite markers difference between two genotypes; 4 or more microsatellite markers difference between genotypes are demonstrated with dotted branches.

