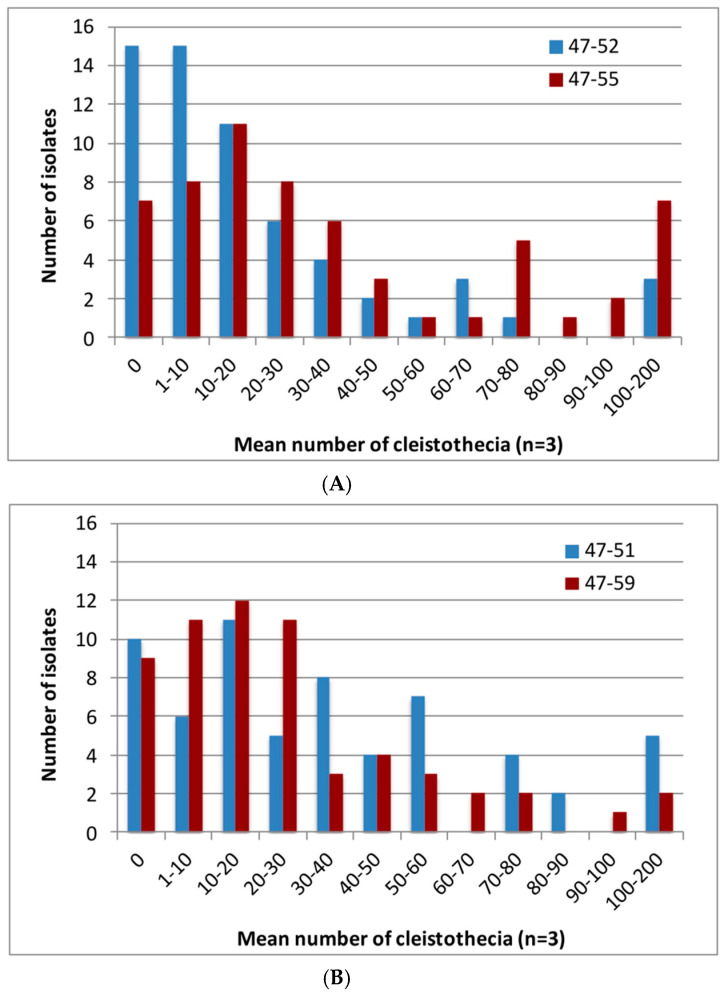
Figure 2.
Variation in mean number of cleistothecia produced in crosses with different worldwide isolates of A. fumigatus. (A) Numbers of cleistothecia produced by MAT1-1 global isolates (per 9 cm Petri dish), in crosses with two Irish MAT1-2 tester strains (47-52, 47-55). (B) Numbers of cleistothecia produced by MAT1-2 global isolates (per 9 cm Petri dish), in crosses with two Irish MAT1-1 tester strains (47-51, 47-59). Left hand axis shows the number of isolates producing the mean number of cleistothecia shown on axis below.

