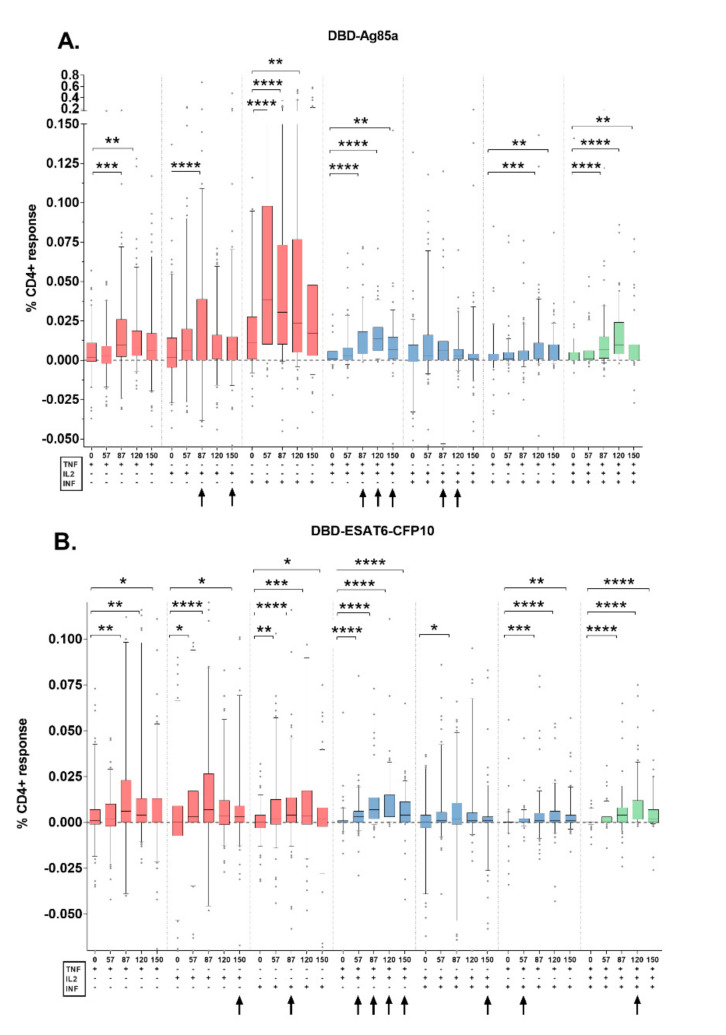
Figure 2.
Cytokine expression profiles of CD4+ T-cells following stimulation with GamTBvac components in the vaccine recipients’ group. (A). Stimulation of samples with DBD-Ag85a; (B). Stimulation of samples with DBD-ESAT6-CFP10. Black arrows indicate specific CD4+ T-cells responses that differ significantly from those in the placebo group with a minimum p < 0.05. Medians and interquartile ranges are shown. * p < 0.05, ** p < 0.01, *** p < 0.001, **** p < 0.0001.

