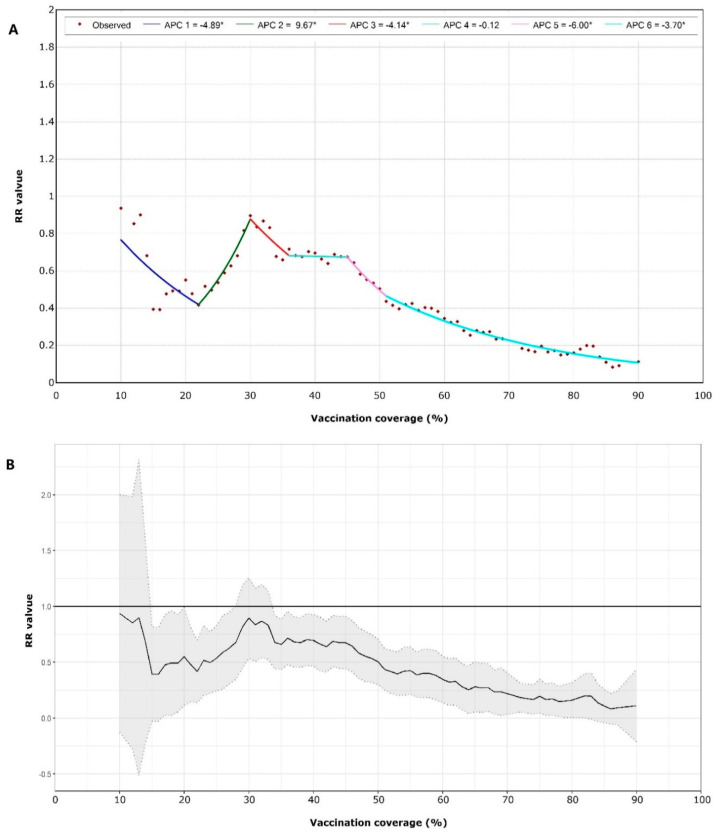
Figure 2.
(A) Joinpoint model of relative risk (RR) values for different vaccination coverage. There are five joinpoints for the model. The symbol * is shown if the annual percent change (APC) is significantly different from zero at level 0.05. (B) RR values for vaccination coverage from 10% to 90% with 95% confidence interval.

