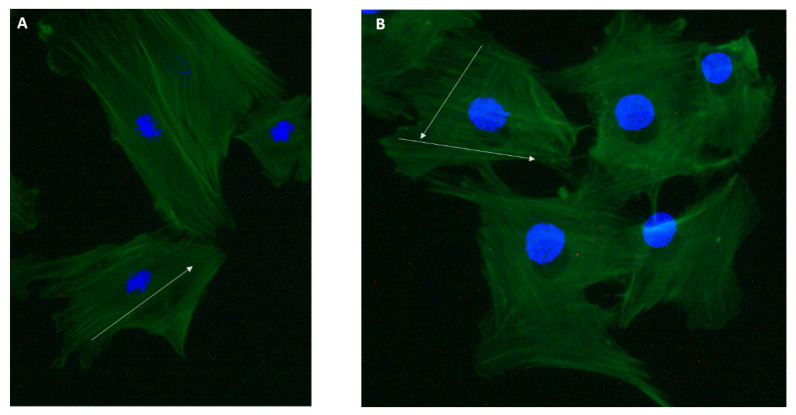
Figure 6.
(A) Cell’s cytoskeleton for the control group, and (B) cell’s cytoskeleton for the bubble-propagated group. The green color represents actin filaments, and blue is the nucleus stained with DAPI (4’,6-Diamidino-2-Phenylindole). The white arrow represents the direction of actin filaments’ orientation.

