
Figure 4.
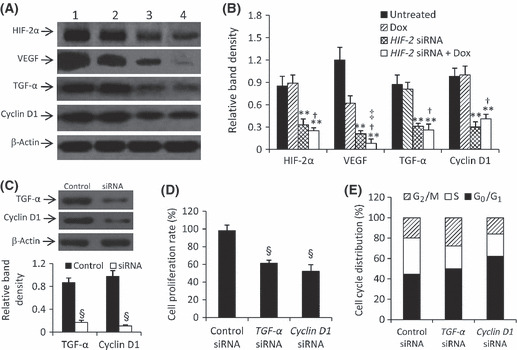
Gene expression and effects of downregulating downstream genes. (A) Untreated HepG2 cells (lane 1) or cells treated with doxorubicin (Dox; lane 2), HIF‐2 siRNA (lane 3) or HIF‐2 siRNA + Dox (lane 4; from Fig. 3B) were subjected to western blot analysis. (B) The density of each band in (A) was measured and normalized against that of β‐actin. Data are the mean ± SD. *P < 0.05, **P < 0.001 compared with untreated cells; †P < 0.05 compared with Dox‐treated cells; ‡P < 0.05 compared with HIF‐2 siRNA‐treated cells. (C–E) Control siRNA, transforming growth factor (TGF)‐α siRNA or Cyclin D1 siRNA‐transfected HepG2 cells were cultured in the presence of CoCl2 for 48 h; the expression of TGF‐α and Cyclin D1 was determined by western blot analysis (C), with band density normalized against that of β‐actin, and cell proliferation (D) and cell cycle distribution (E) were measured. Data are the mean ± SD. §P < 0.001 compared with control.