
Figure 6.
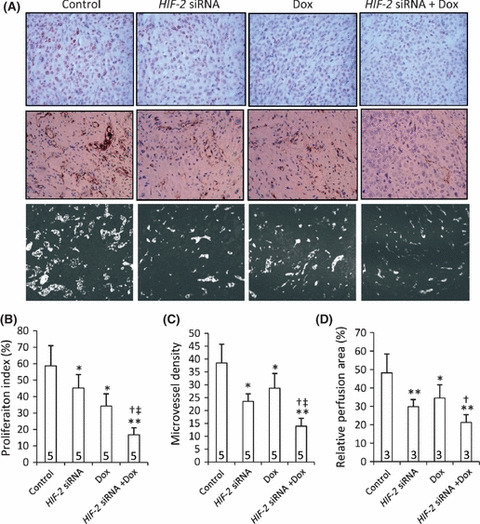
Tumoral cell proliferation, angiogenesis and microvessel perfusion. (A) Representative tumor sections prepared 3 weeks after treatment (from Fig. 5) and stained with an anti‐Ki‐67 Ab (upper panel) or an anti‐CD31 Ab (middle panel), or prepared from mice preinjected with Hoechst 33342 (represented by light‐colored regions). The proliferation index (B), microvessel density (C), and microvessel perfusion area (D) were determined for each group. Dox, doxorubicin. Data are the mean ± SD, with the number of samples indicated by the numbers at the bottom of each column. *P < 0.05, **P < 0.001 compared with untreated cells; †P < 0.05 compared with Dox‐treated cells; ‡P < 0.05 compared with HIF‐2 siRNA‐treated cells.