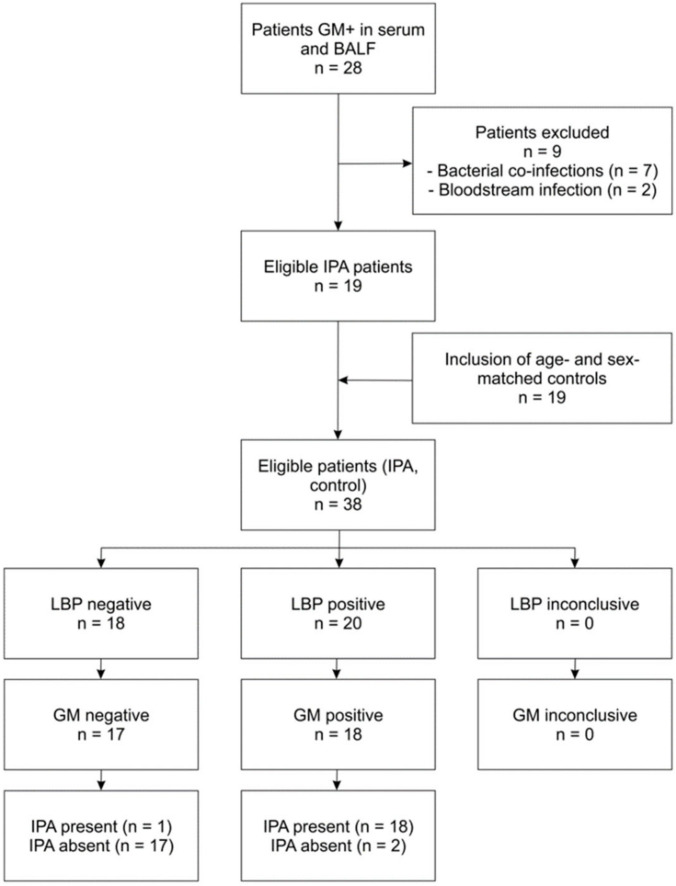
Figure 1.
Flowchart indicating selection of patients and performance. The chart is exemplified for LBP in BALF as the index test, and GM in BALF as the reference test. The test positivity cut-off point of 18.9 pg/mL for LBP was determined according to the results of the ROC curve analysis depicted in Figure 2. Compared to GM, LBP displayed a sensitivity of 94.7%, a specificity of 84.2%, a positive predictive value (PPV) of 0.90 and a negative predictive value (NPV) of 0.94 in the selected patient group.

