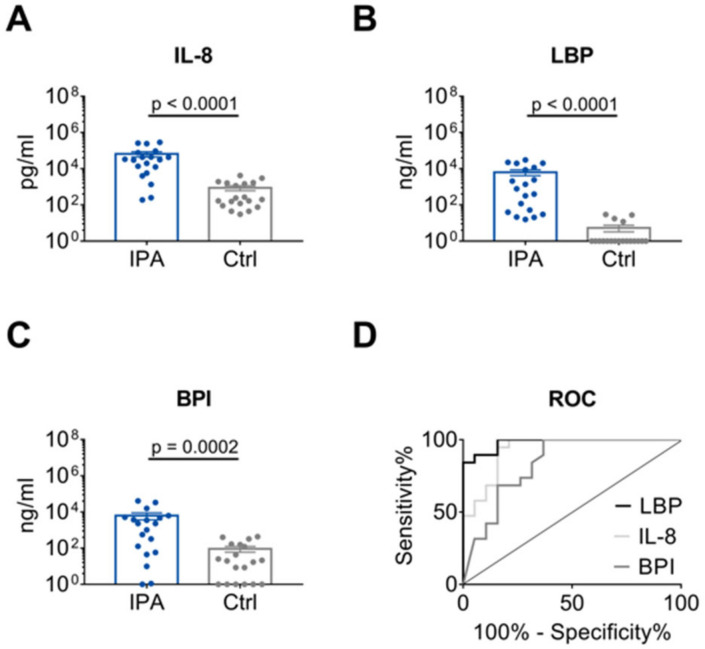
Figure 2.
Distinction of IPA and Ctrl patients by IL-8, LBP and BPI. (A–C) Levels of IL-8, LBP and BPI in the BALF of 19 patients with IPA compared with 19 age- and sex-matched Ctrl patients. Data are presented as mean ± SEM. P-values were determined by Mann-Whitney U test. (D) AUC as determined by ROC curve analysis for IL-8, LBP and BPI values depicted in (A–C) for IPA and Crtl patients.

