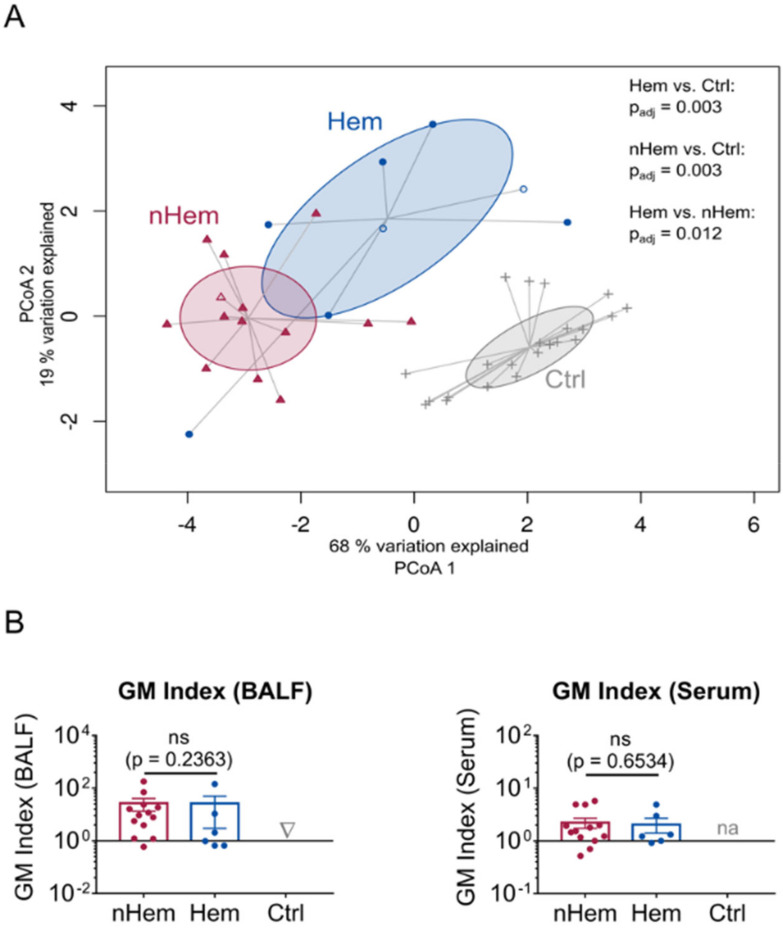
Figure 3.
Comparison of tested biomarkers in the subgroup of nHem and Hem patients. (A) PCoA including CRP, WBC, GM in BALF, IL-8, IL-1β, LBP, BPI and MPO. Filled red symbols indicate nHem patients (n = 13), filled blue symbols Hem patients (n = 6) and grey symbols patients of the control group (Ctrl; n = 19). Patients not meeting inclusion criteria, because serum GM was beneath the cut-off point despite typical radiological findings, are marked as non-filled symbols (n = 3). Differences between subgroups were analyzed by permutational multivariate analysis of variance. P-values adjusted for multiple testing by the Bonferroni correction method are indicated (p adj). (B) GM in BALF and serum are compared between nHem (n = 13), Hem patients (n = 6) and control group (n = 19). Data are presented as mean ± SEM and p-values were determined by Mann-Whitney U test, non-significant (ns) results are marked. GM of serum in the control group was not analyzed (na).

