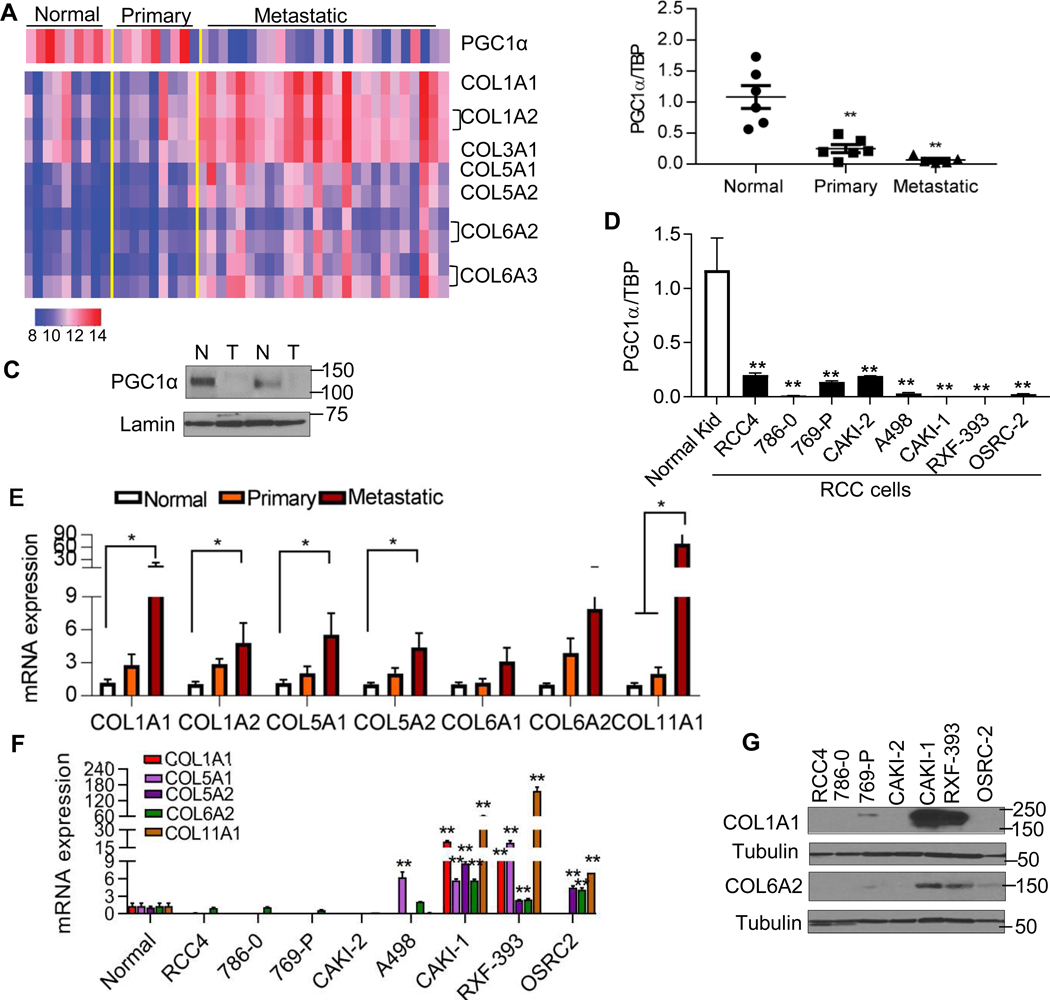
Fig. 1. Gene expression signatures of tumor progression in RCC.
(A) Heatmap representing expression patterns of PGC1α and collagen family members (COLs) using the Illumina Human HT-12 v4 bead array in the three-patient groups (normal n=9, primary n=9, and metastasis n=26). Colors in the heatmap represent log transformed quantile normalized expression values for selected set of probes in individual samples. Normalized expression values for probes of selected genes ranged between 8 and 14. Specifically, high expression values indicated in red and low expression values indicated in blue. (B) Quantitative RT-PCR analysis of PGC1α expression in a separate cohort of patient-matched samples. Transcript levels were normalized to those of TBP (n=6/group). (C) Immunoblot analysis of PGC1α in patient-matched normal kidney (N) and tumor (T). (D) Relative mRNA expression of PGC1α in a panel of RCC cell lines compared to primary normal kidney tissue (n=4/group). (E) Relative mRNA expression of COLs in a separate cohort of patient-matched normal, primary, and metastatic tumor deposits. (F) Relative mRNA expression of COLs in a panel of RCC cell lines compared to primary normal kidney tissue (n=4/group). (G) Western blot analysis of COL1A1 and COL6A2 in a panel of RCC cell lines. All data represent 3 independent experiments and error bars are SEM. Asterisks indicate significant differences compared to normal kidney (*P<0.05, **P<0.01, One-way ANOVA with Tukey’s multiple comparisons test).

