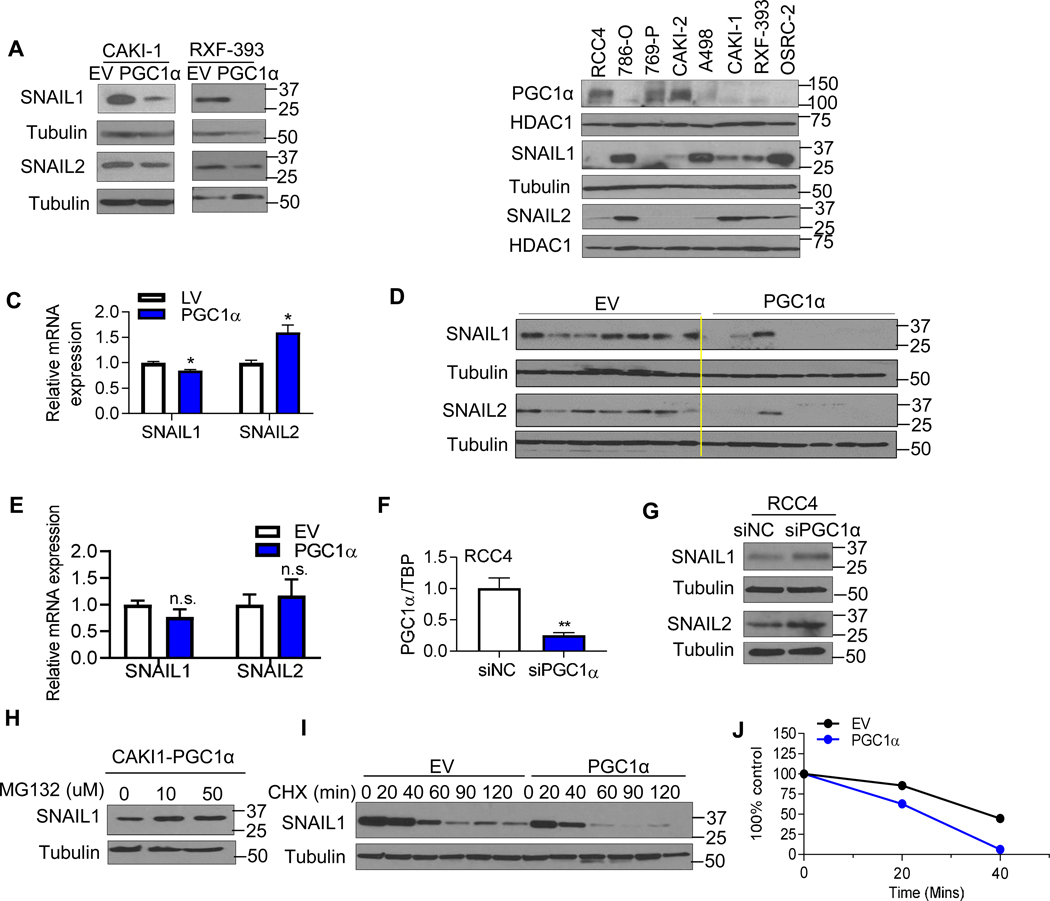
Fig. 4. PGC1α destabilizes the SNAIL protein in ccRCC.
(A) Western blot analysis of SNAIL1 and SNAIL2 in the stable CAKI-1 and RXF-393 cells expressing an EV or PGC1α. (B) Immunoblot analysis of PGC1α, SNAIL1, and SNAIL2 in a panel of RCC cell lines. HDAC1 was used to normalize protein loading. (C) Relative mRNA expression of SNAIL1 and SNAIL2 in stable CAKI-1 cells expressing an EV or PGC1α (n=3/group). TBP was used as normalizing control for gene expression. (D) At 6 weeks from tumor challenge, kidney tumors were harvested and analyzed for the expression of SNAIL1 and SNAIL2 (n=7/group). (E) Relative mRNA expression of SNAIL1/2 in dissected kidneys injected tumors cells at 6 weeks from tumor challenge (n=7/group). (F) Relative mRNA expression of PGC1α in RCC4 cells transfected with either 50 nM negative control siRNA (NC) or PGC1α siRNA for 48 hr (**P<0.01, 2 tail student t test). (G) Western blot analysis of SNAIL1 and SNAIL2 in RCC4 cells transfected with either 50 nM NC or PGC1α siRNA for 48 hr. (H) Stable PGC1α expressing CAKI-1 cells were treated with the indicated concentration of proteasome inhibitor MG132 for 4 hr. SNAIL1 protein levels were analyzed by immunoblot analysis. (I) CAKI-1 cells stably expressing an EV or PGC1α were incubated with 10 μg/ml cycloheximide (CHX) for the indicated times. Cell lysates were immunoblotted with SNAIL1 and tubulin antibodies. (J) Immunoblot analysis of SNAIL as shown in (I) was quantified using Image J program. All data represent 3 independent experiments and error bars are SEM (*P<0.05, **P<0.01, 2 tail student t test).

