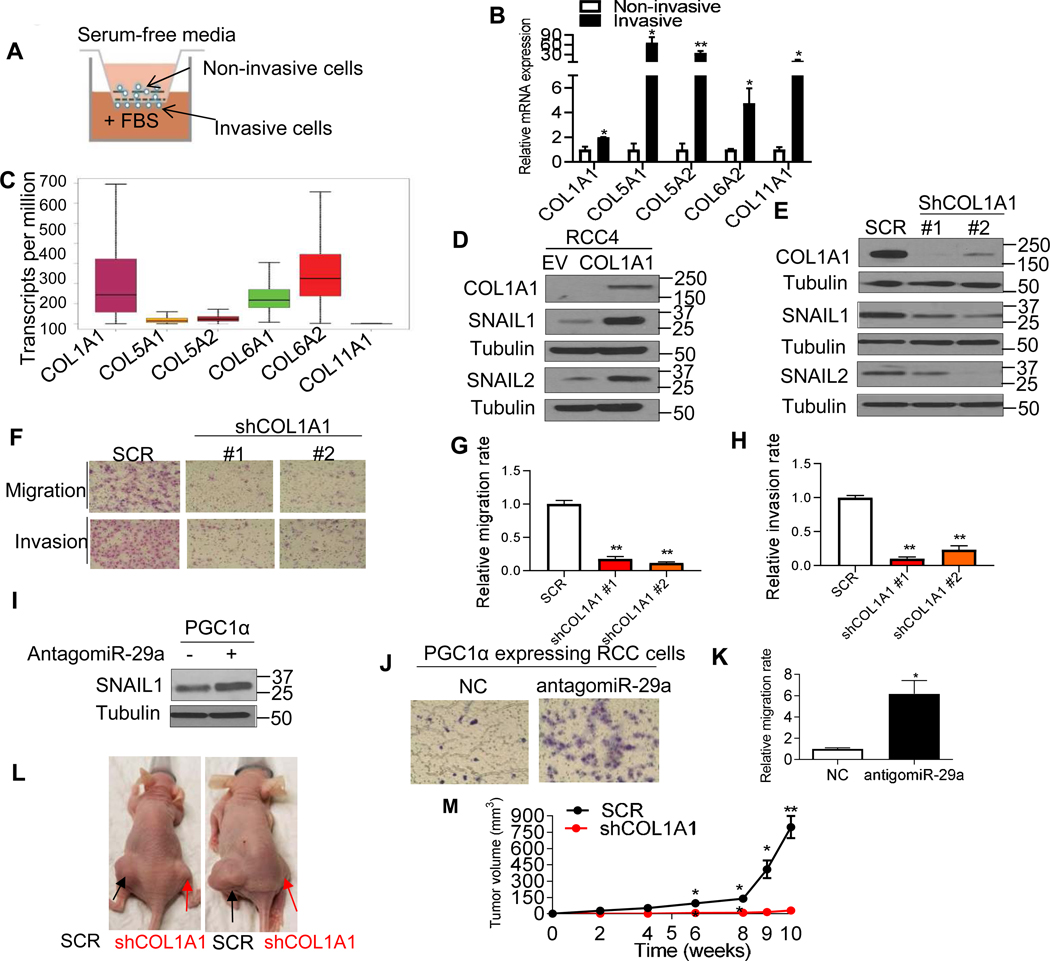
Fig. 5. COL1A1 knockdown diminishes the migratory and invasive phenotype in ccRCC.
(A) Schematic diagram representing the isolation of non-invasive and invasive cells using a Boyden invasion chamber with Matrigel insert. CAKI-1 cells were seeded in the chambers for 24 h. The non-invasive cells from inside of the chamber as well as invasive cells from the bottom of the membrane were separately harvested. (B) Relative mRNA expression of COLs in invasive cells relative to non-invasive cells. 18S used as a housekeeping gene (n=3/group). (C) RNA-Seq analysis of gene expression for COLs in the renal tumors in the TCGA data set. (D) Western blot analysis of the indicated proteins in RCC4 cells stably expressing an EV or COL1A1 cDNA. (E) Western blot analysis of the indicated proteins in CAKI-1 cells stably expressing shRNA control (SCR) or two independent COL1A1 shRNA constructs. (F) Representative images and (G and H) quantification of migratory and invasive phenotype in CAKI-1 cells. (I) Western blot analysis of SNAIL1 in PGC1α-expressing CAKI-1 cells after transfection with either NC or antigomiR-29a for 48 hr. (J) Representative images and (K) relative quantification of Transwell migration assay in CAKI-1 cells stably expressing PGC1α after transfection with NC or antigomiR-29a for 48 h (n=3/group). (L) Representative images of nude mice showing tumor growth of CAKI-1 cells. Two million CAKI-1 cells stably expressing SCR or COL1A1 shRNA were subcutaneously injected into the flanks of female BALB/c nu/nu mice at 5–7 weeks old (n=6/group). (M) Caliper measurements of the tumor volumes were taken on the indicated weeks. All data are presented as mean ± SEM (*P<0.05, **P<0.01).

