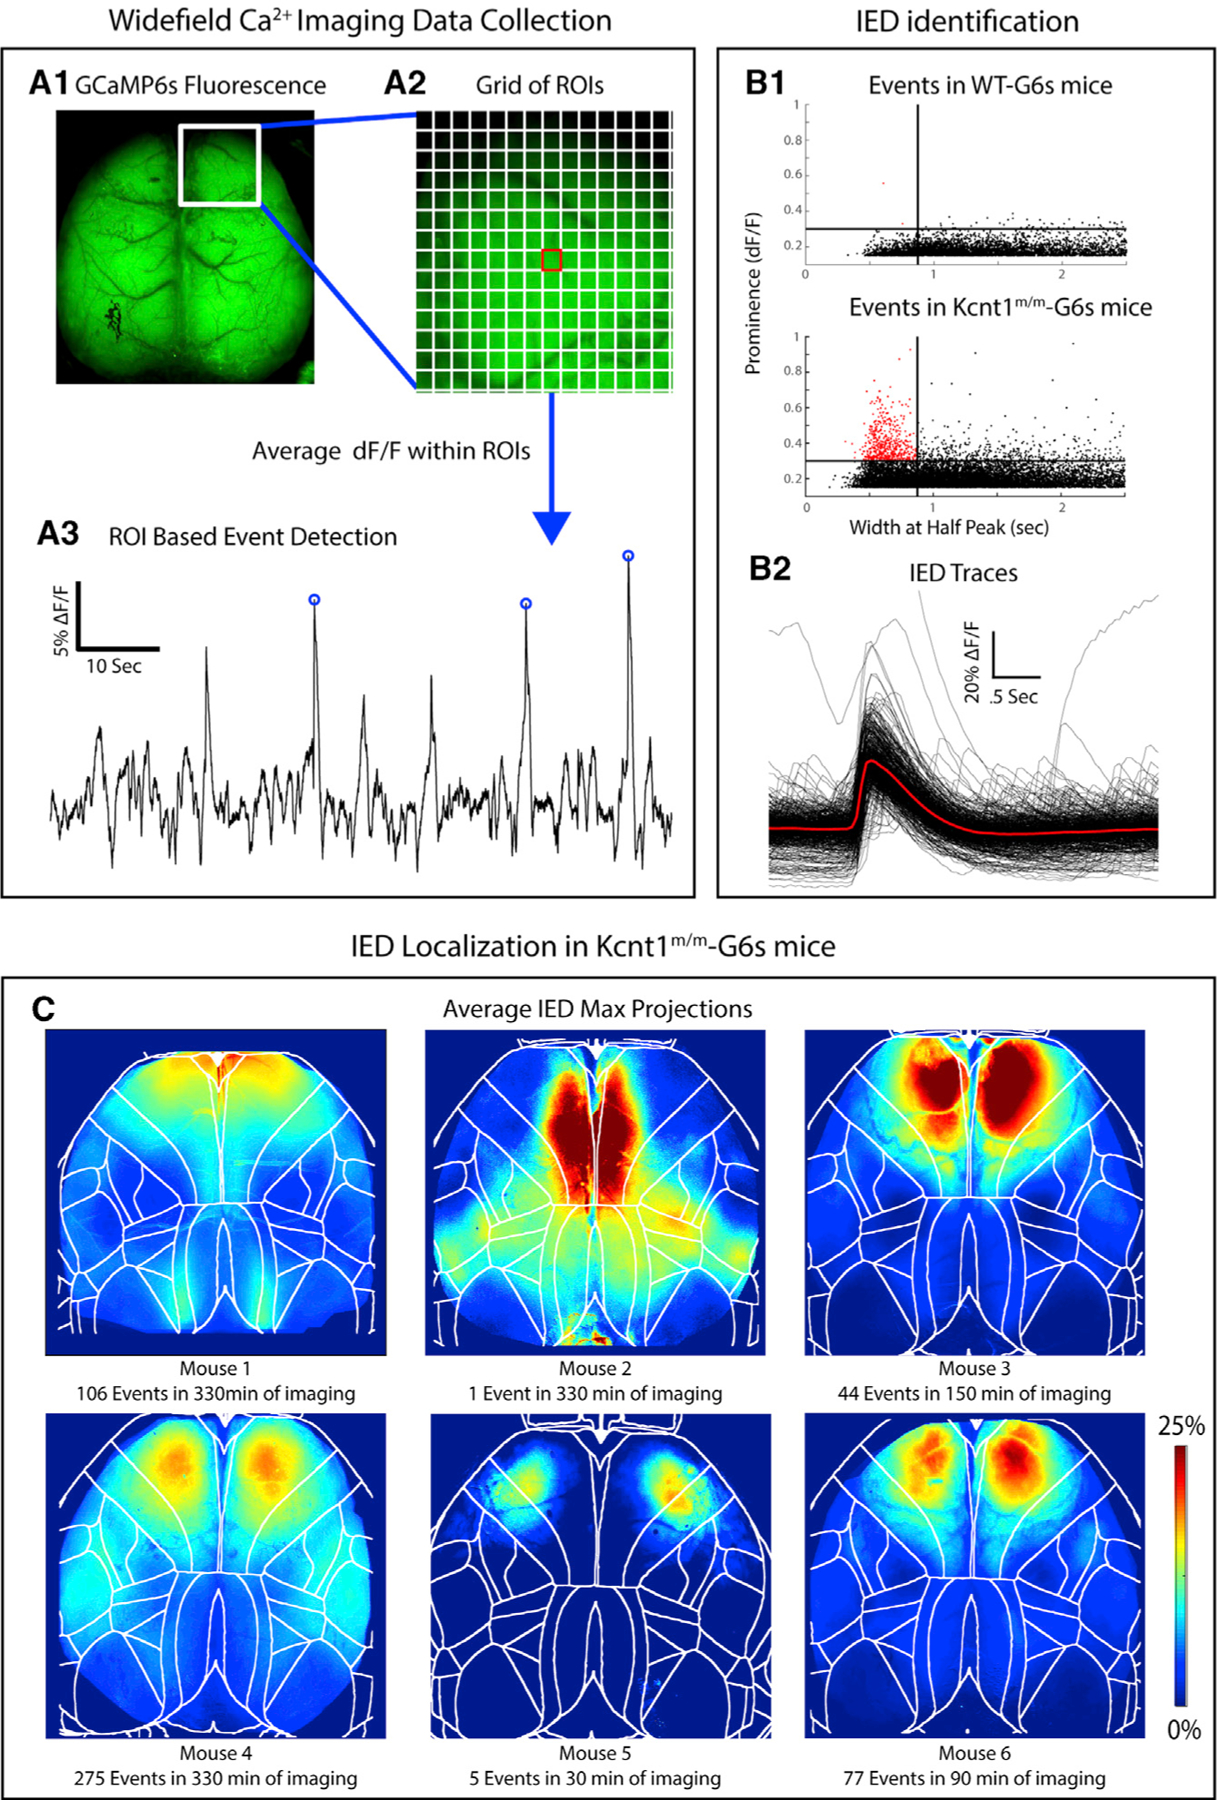
Figure 2. Interictal Epileptiform Discharges (IEDs) in Kcnt1m/m Mice Localize to the Secondary Motor Cortex.

(A1) GCaMP6s fluorescence in the brain of a Kcnt1m/m-G6s mouse. (A2) Illustration of the grid of regions of interest (ROIs) used in event detection superimposed on a portion of the GCaMP6s fluorescence image. (A3) ΔF/F peaks with a prominence greater than 15% were identified in each ROI.
(B1) Maximum event prominence plotted as a function of width at half-maximum for WT-G6s and Kcnt1m/m-G6s mice. Kcnt1m/m-G6s mice generate events (narrow, high prominence) not seen in WT-G6s. Lines at 875 ms and 30% ΔF/F indicate our criteria for classifying events as IEDs. (B2) Overlaid ΔF/F traces of all IEDs in all Kcnt1m/m-G6s mice with the mean waveform in red. The Kcnt1m/m plot was cropped to highlight the region containing IEDs, which obscures one large event (0.52, 2.17).
(C) To investigate the cortical localization of spike-like events, we generated a maximum projection across all event frames for each IED. The average of these is shown for each Kcnt1m/m-G6s mouse, showing consistent peak localized to the anterior medial cortex, mostly within primary and secondary motor cortices. Boundaries indicate cortical regions demarcated by aligning brains to the Allen Common Coordinate Framework (CCF) (see STAR Methods).
