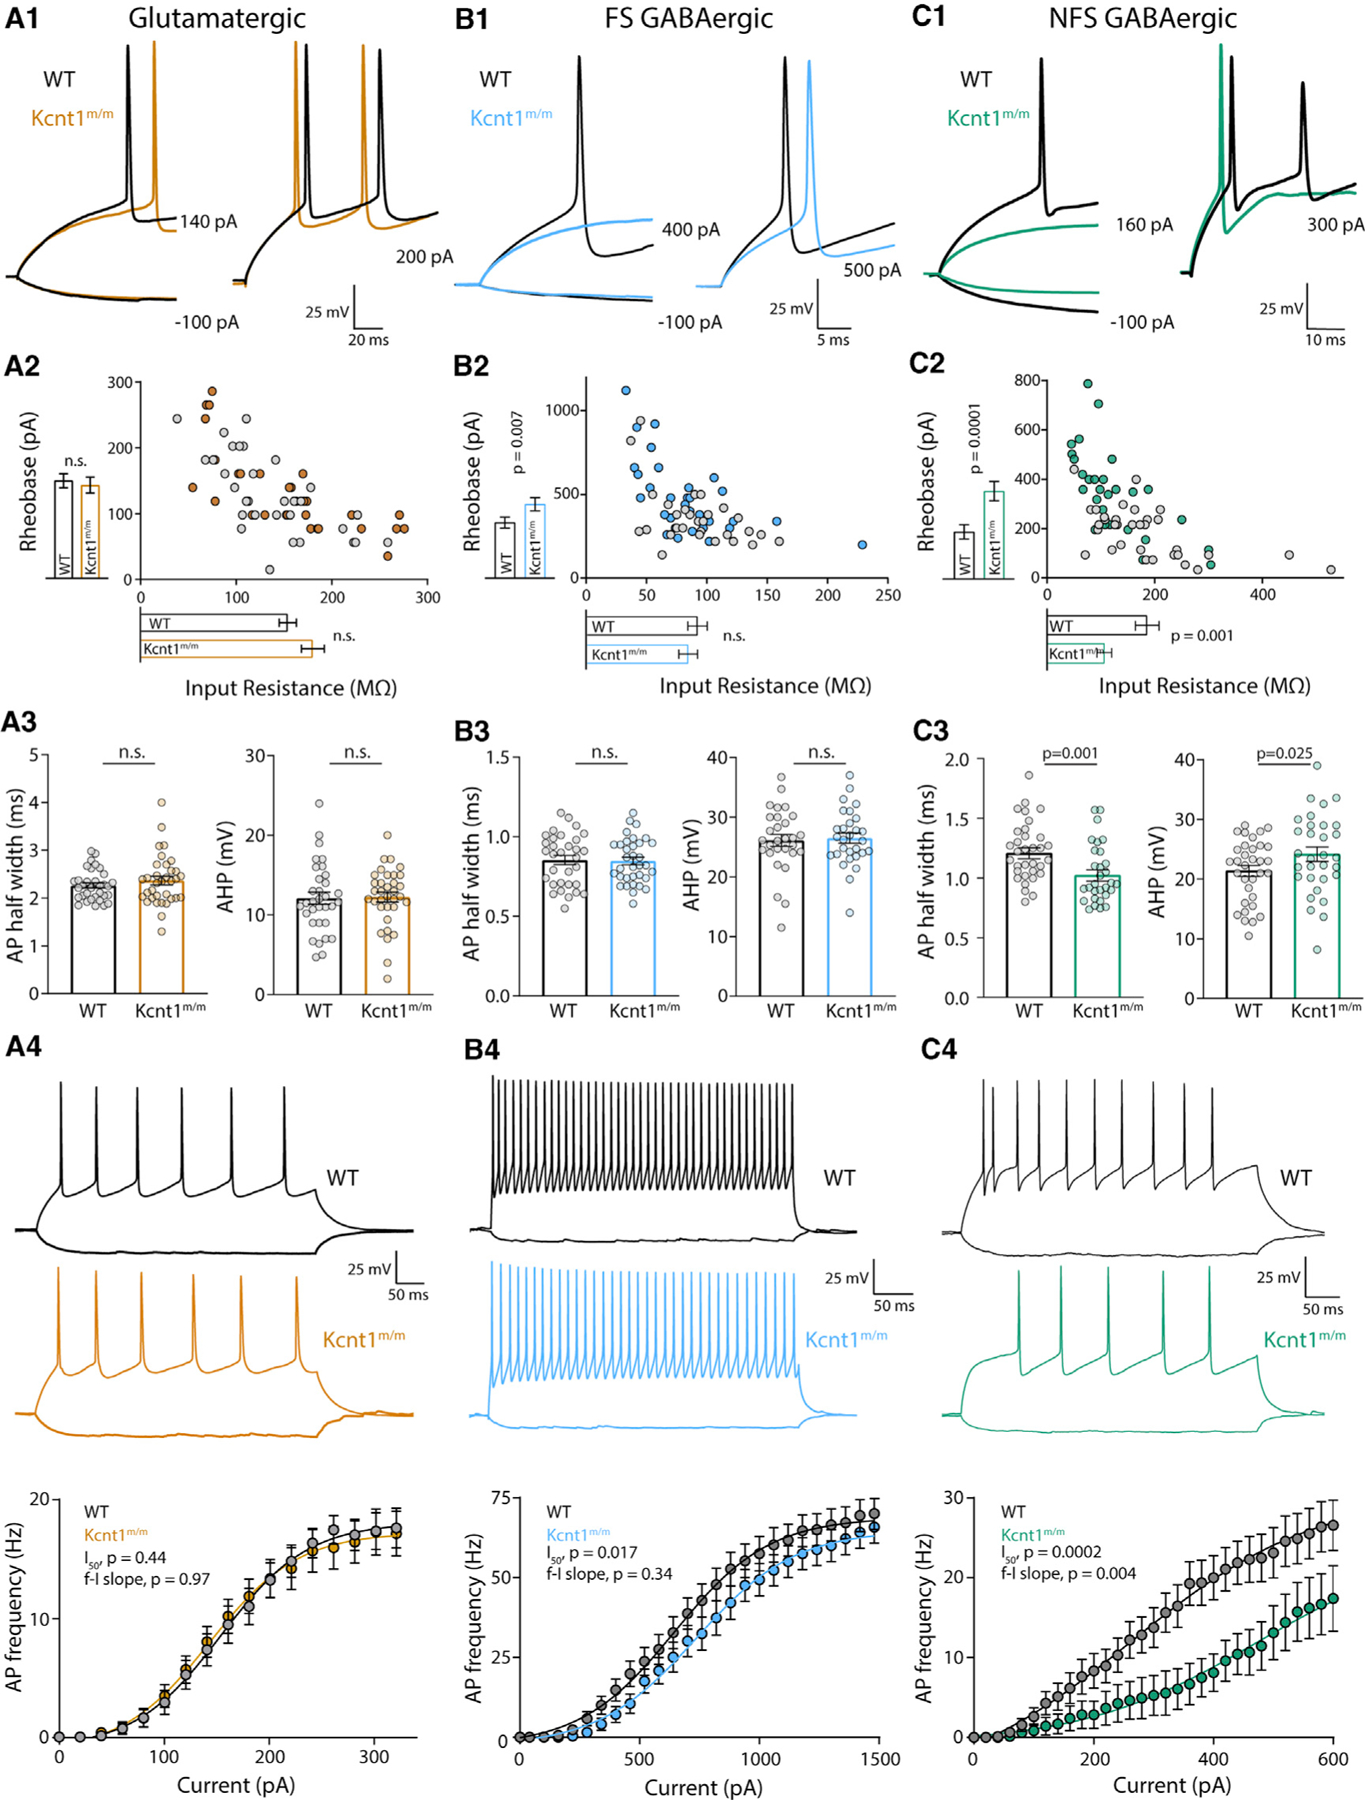
Figure 4. The Kcnt1 Y777H Variant Causes a Reduction in Membrane Excitability and AP Generation in GABAergic, but Not Glutamatergic, Cortical Neurons.

(A1–C1) Representative membrane voltage traces of WT (black) and Kcnt1m/m (colors) neurons of the indicated type in response to current injections illustrate differences in the input resistance (Rin) and/or rheobase between WT and Kcnt1m/m GABAergic neurons.
(A2–C2) The individual values of Rin (x axis) and rheobase (y axis) for WT (gray) and Kcnt1m/m (colors) neurons. The mean and SEM for each group are indicated by the bars next to the corresponding axis.
(A3–C3) Individual values and mean ± SEM for AP half-widths and AHP in WT (black and gray) and Kcnt1m/m (colors) neurons.
(A4–C4) Example traces and summary data showing the number of APs (mean and SEM) per current injection step in WT (black and gray) and Kcnt1m/m (colors) neurons. The lines in the current/AP plots are fits to a Boltzmann sigmoidal curve and were used to determine the half-max current (I50) and the frequency-current (f-I) slope for each group. Statistical significance was tested using generalized linear mixed models.
