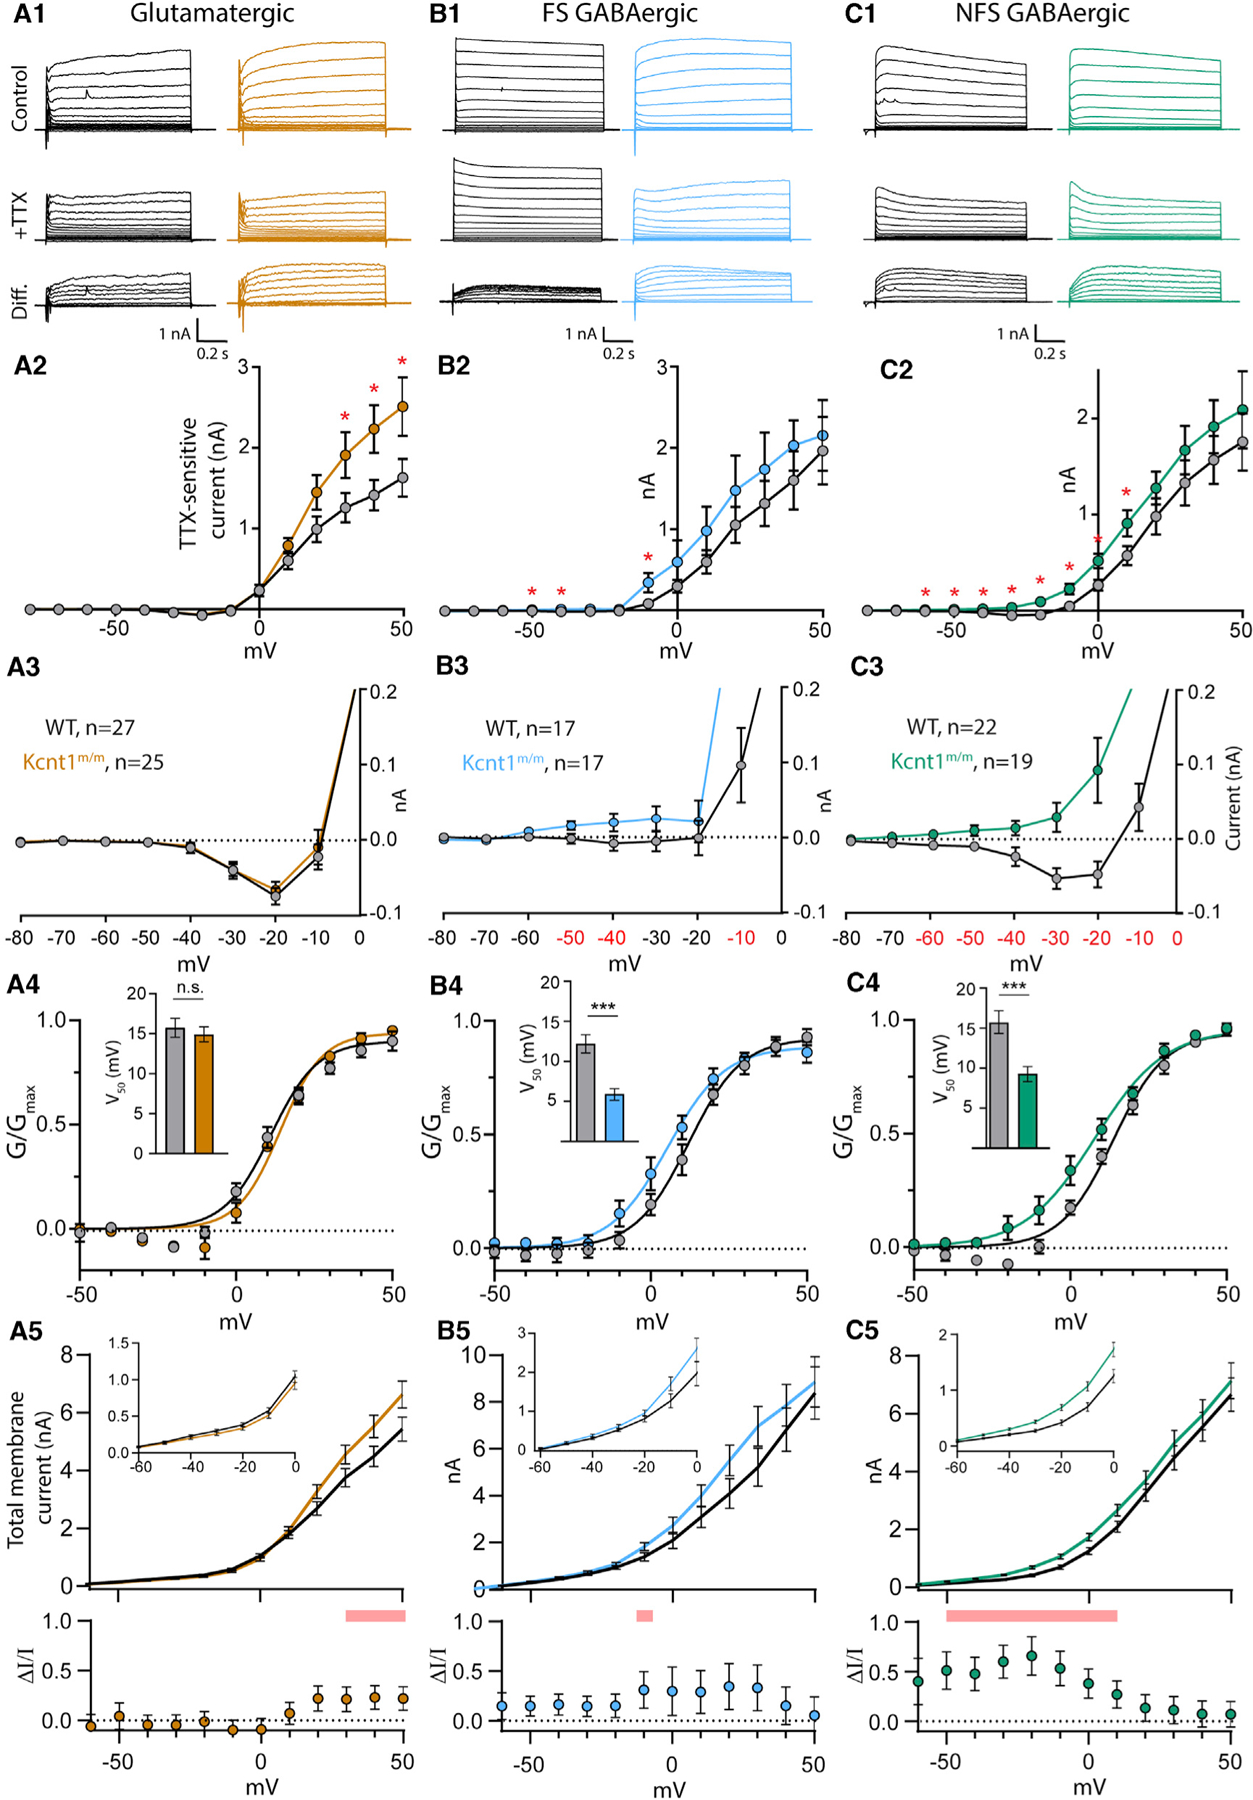
Figure 5. The Y777H Variant Causes Cell-Type-Specific Increases in KNa Currents.

(A1–C1) Representative traces in control external solution (top), 0.5 mM TTX (middle), and the difference current (bottom), which was calculated by subtracting the membrane current response to voltage steps (−80 to +50 mV) in TTX from the response in control, in WT (black) and Kcnt1m/m (colors) neurons.
(A2–C2) Summary data show the KNa current (mean ± SEM) for each voltage step in WT (black and gray) and Kcnt1m/m (colors) neurons.
(A3–C3) Plots of the KNa current (mean ± SEM) for each voltage step from −80 to 0 mV in WT (black and gray) and Kcnt1m/m (colors) neurons to illustrate the values that are too small to be seen on the graphs in A2-C2.
(A4–C4) Normalized Conductance-Voltage (G-V)plots (mean ± SEM) for WT (black and gray) and Kcnt1m/m (colors) neurons with Boltzmann fits. Insets show the Vm at half-maximum (V50; mean ± SEM).
(A5–C5) Plots of the total membrane current (mean and SEM) for each voltage step from −60 to +50 mV in WT (black) and Kcnt1m/m (colors) neurons. Insets show values too small to be seen on the larger graph. Shaded red areas indicate significantly higher currents in Kcnt1m/m neurons. The plots below show the fractional increase in the total membrane current (ΔI/I, mean ± SEM) caused by the Y777H variant. Statistical significance for Current-Voltage (I-V) plots was tested using generalized linear mixed models with genotype and current step as fixed effects followed by pairwise comparisons at each level.
p values < 0.05 are labeled on the plots in A2–C2 as asterisks and on the plots in A3–C3 as red numbers. p values < 0.001 are labeled on the plots in A4–C4 as three asterisks. See also Figures S4 and S5.
