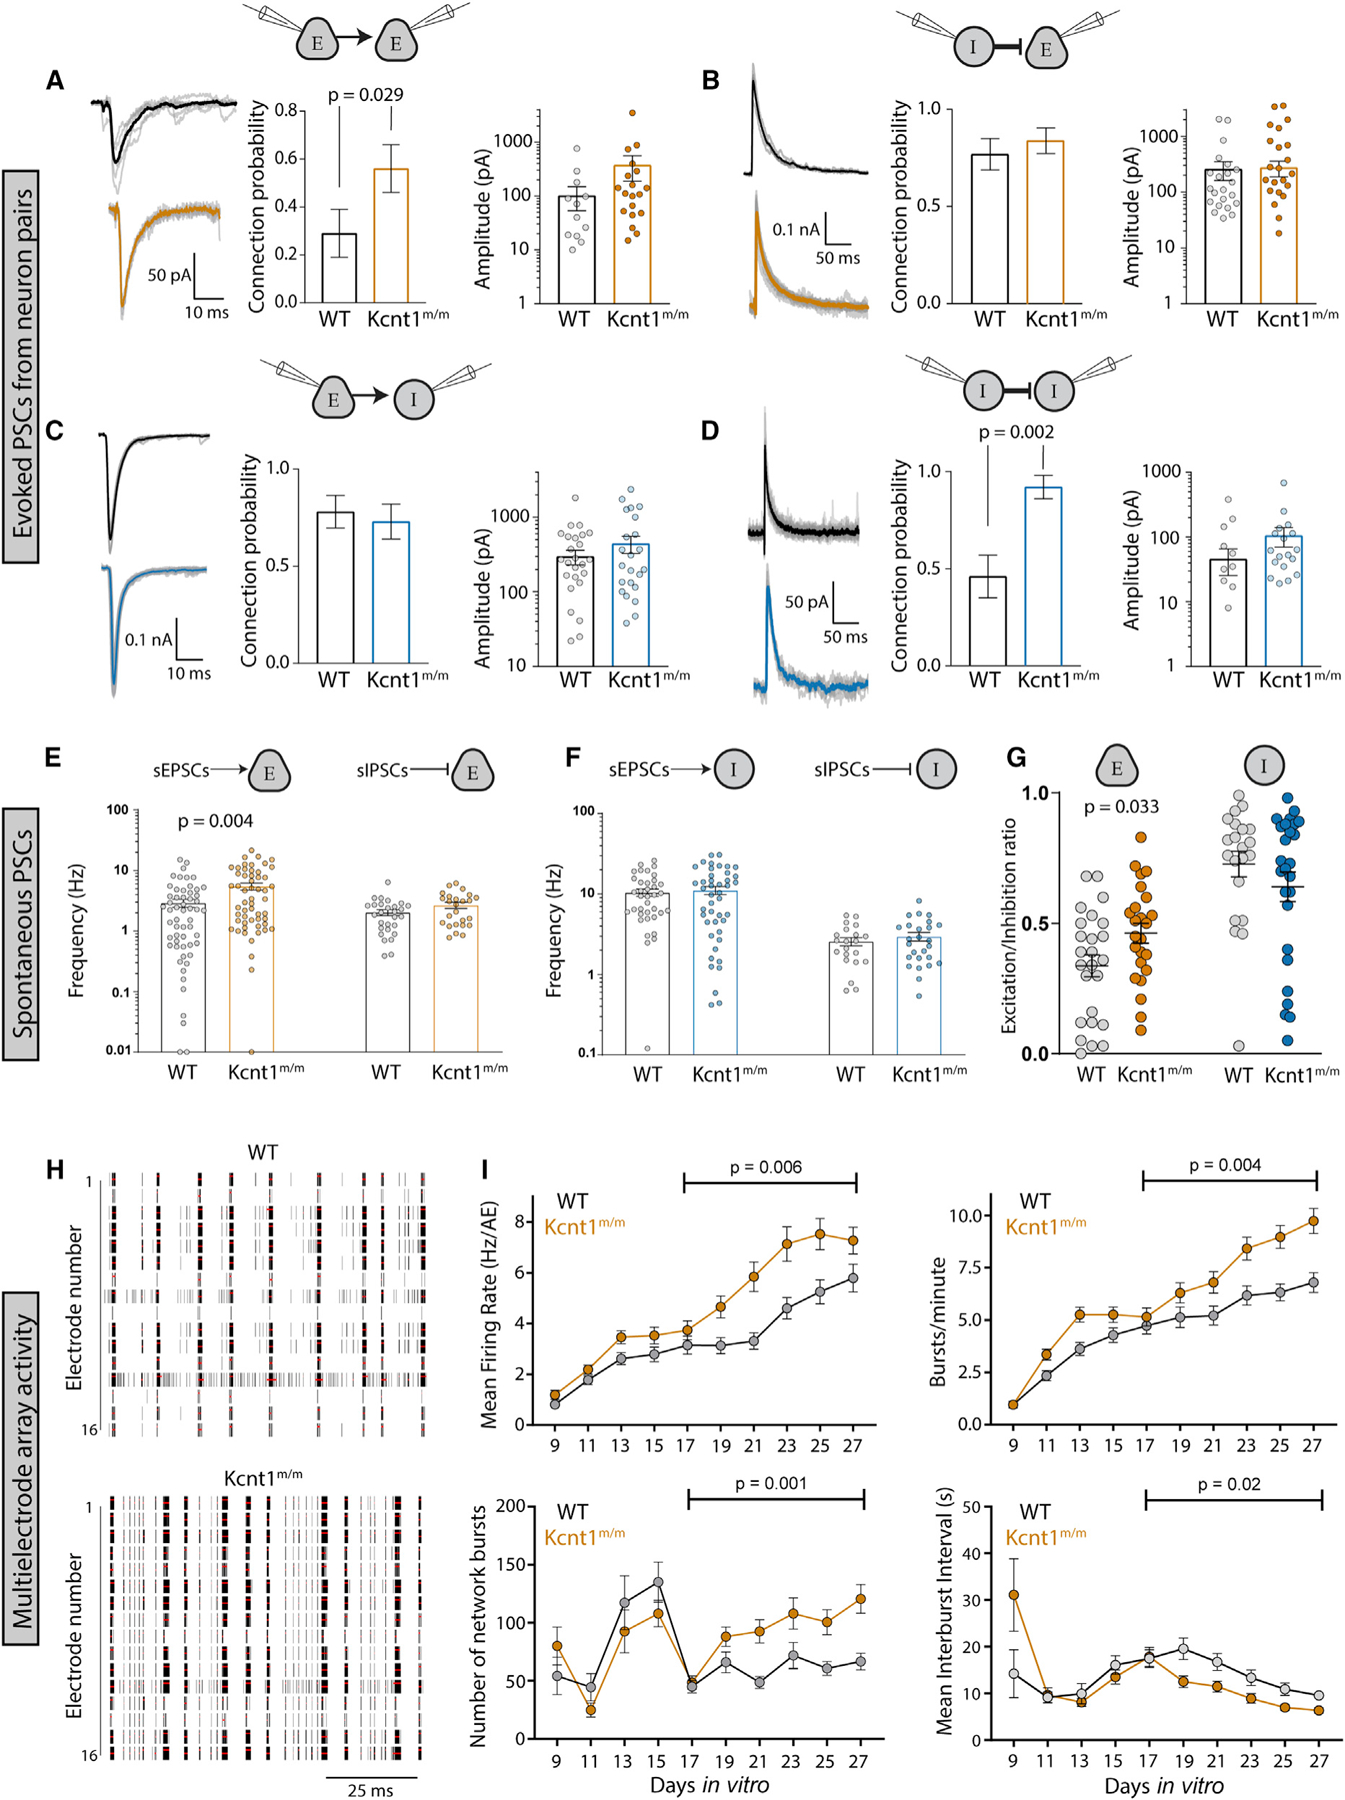
Figure 6. Increases in Synaptic Connectivity in Kcnt1m/m Networks Contribute to Hyperexcitability and Hypersynchrony.

(A–D) Evoked postsynaptic currents (PSCs) recorded from neuron pairs (glutamatergic [excitatory (E)] and GABAergic [inhibitory (I)]) by stimulating the neuron type indicated on the left and recording the response in the neuron type indicated on the right (WT, black; Kcnt1m/m E, orange; Kcnt1m/m I, blue). Left: example traces of evoked ePSCs. Middle: summary data (mean ± SEM) of the connection probability (Pc) between motifs. Right: individual pair values and mean ± SEM of peak evoked PSC amplitudes of connected pairs.
(E) Individual values and mean ± SEM of the spontaneous excitatory postsynaptic current (sEPSC) or inhibitory postsynaptic current (sIPSC) frequency onto excitatory neurons (WT, black; Kcnt1m/m, orange).
(F) Individual values and mean ± SEM of the sEPSC or sIPSC frequency onto inhibitory neurons (WT, black; Kcnt1m/m, blue).
(G) The E/I ratio onto excitatory neurons, but not inhibitory neurons, is increased. Individual values and mean ± SEM of the E/I ratios are shown.
(H) Raster plots of multi-electrode array (MEA) data showing WT and Kcnt1m/m cortical network firing across the 16 electrodes of a well of a representative plate at DIV23. The black bars indicate spikes, and the red bars indicate bursts.
(I) Graphs plotting measures of spontaneous activity as a function of DIV on MEAs of WT (gray, n = 65 wells, 5 mice) and Kcnt1m/m (orange, n = 66 wells, 5 mice) cortical neurons. Mean firing rate (MFR) per active electrodes, number of bursts per minute, number of network bursts, and interburst interval are each shown as the mean ± SEM. Permutated p values for mature DIV17 to DIV27 neurons calculated with a Mann-Whitney U test followed by 1,000 permutations are indicated on the graphs.
