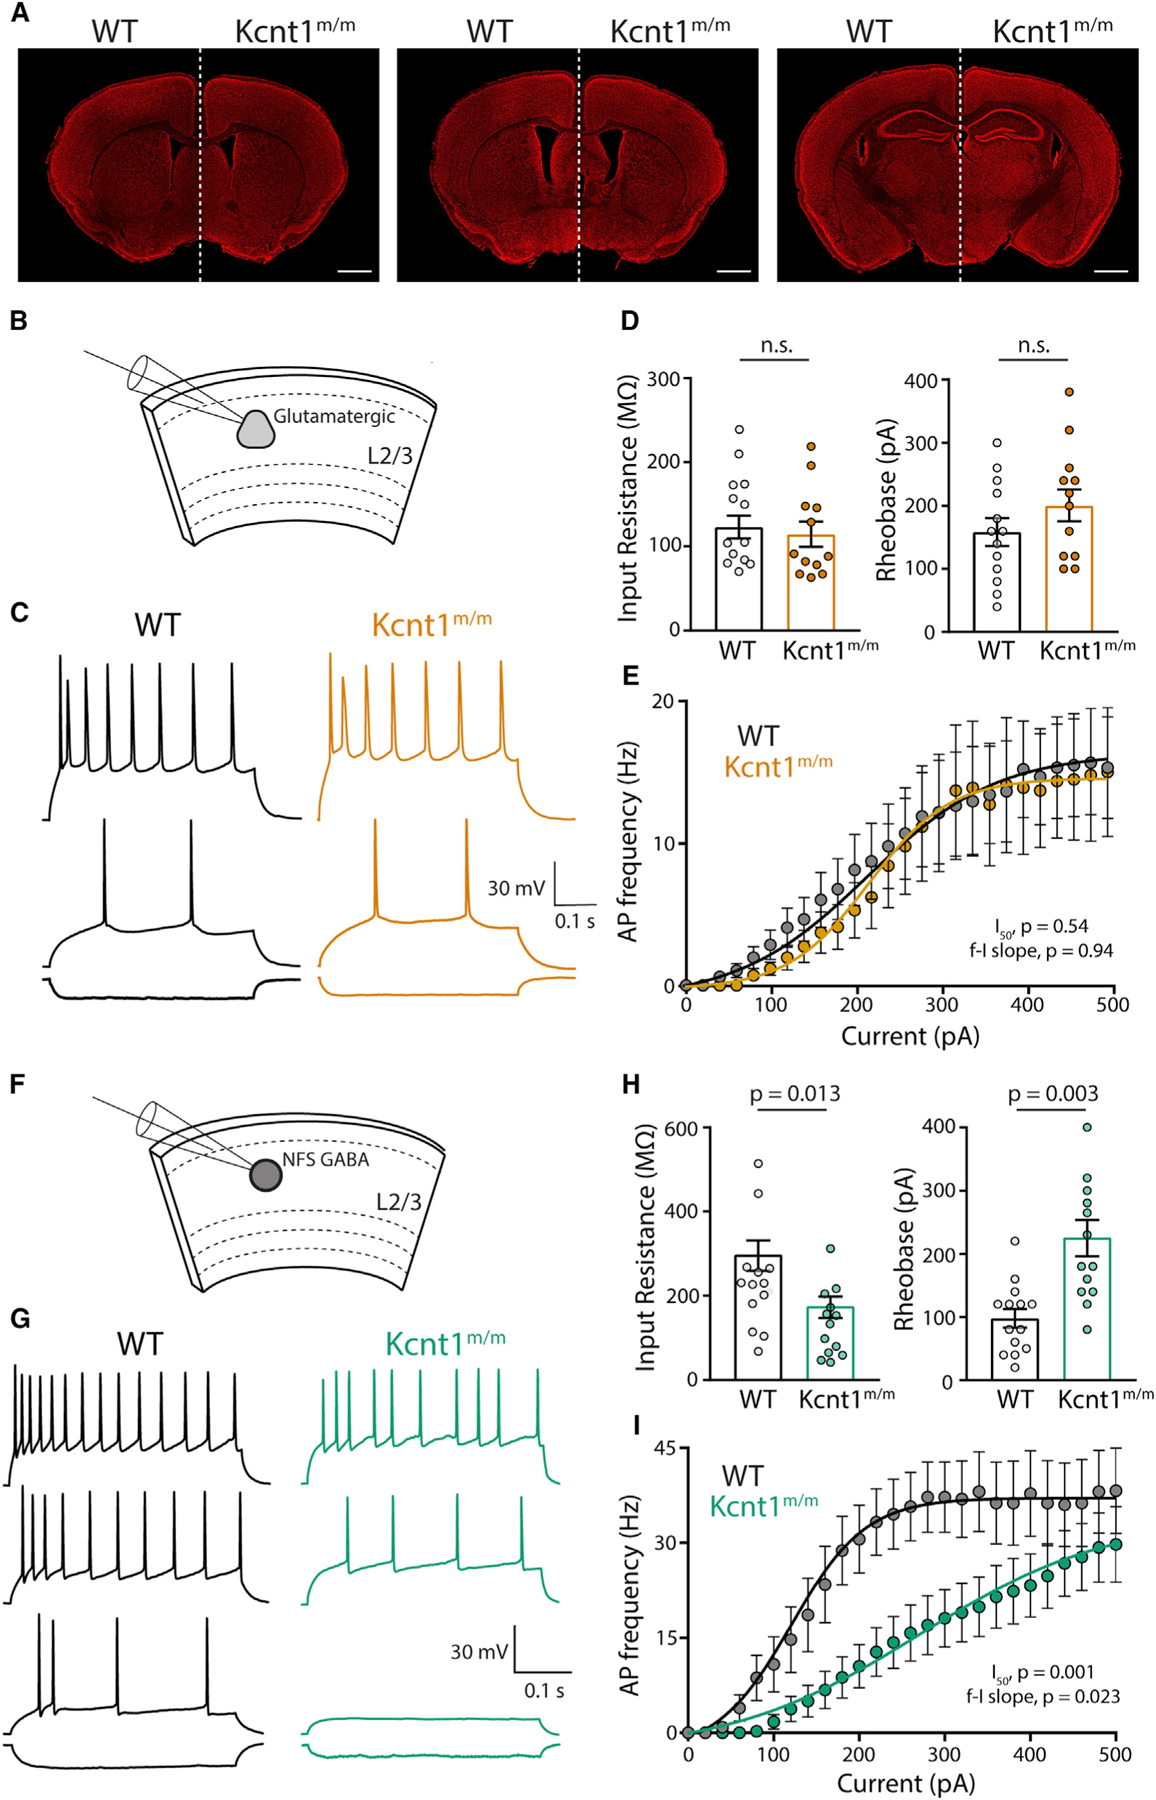
Figure 7. NFS GABAergic Neurons in Layer 2/3 of Acute Slices from Motor Cortex of Kcnt1m/m Mice Show a Strong Impairment in AP Generation.

(A) Representative images of 10-week-old, Nissl-stained coronal sections at three matched bregma levels from WT (left) and Kcnt1m/m (right) mice. Scale bar, 1 mm.
(B) Schematic shows the experimental approach of recording glutamatergic neurons in layer 2/3 of the motor cortex.
(C) Representative membrane voltage traces of glutamatergic WT (black) and Kcnt1m/m (orange) neurons in response to −100, +140, and +240 pA current injections.
(D) Individual neuron values, mean, and SEM of the Rin and rheobase of WT and Kcnt1m/m glutamatergic neurons.
(E) Number of APs (mean ± SEM) per current injection step in WT and Kcnt1m/m glutamatergic neurons.
(F) Schematic shows the experimental approach of recording NFS GABAergic neurons in layer 2/3 of the motor cortex.
(G) Representative membrane voltage traces of NFS GABAergic WT (black) and Kcnt1m/m (green) neurons in response to −100, +100, +180, and +300 pA current injections.
(H) Individual neuron values, mean, and SEM of the Rin and rheobase of WT and Kcnt1m/m NFS GABAergic neurons.
(I) Number of APs (mean ± SEM) per current injection step in WT and Kcnt1m/m NFS GABAergic neurons. The lines in the current/AP plots are fits to a Boltzmann sigmoidal curve that were used to determine the I50. Statistical significance was tested using generalized linear mixed models.
See also Table S4.
