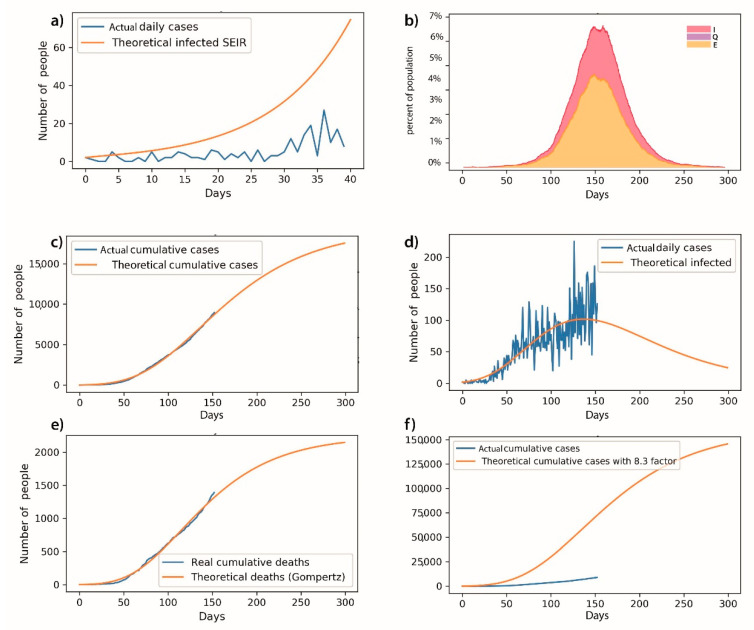
Figure 3.
The adjustment of the SEIR, SEIRS+ package, and Gumpertz model is observed with the parameters described above. The resulting curves are shown below, where curve (a) shows the initial adjustment of SEIR curve, (b) shows the adjustment of SEIRS+ Network Model curve, (c) shows the infection curve with daily official cases, (d) shows the adjustment of official data with the theoretical curve development, (e) shows the cumulative death curve, and (f) shows the proportion of theoretical deaths according to the model and with the expansion factor (8.3) defined by the Federal Ministry of Health on 4 April 2020 [28] and described by Torrealba et al. [17].

