
Figure 2.
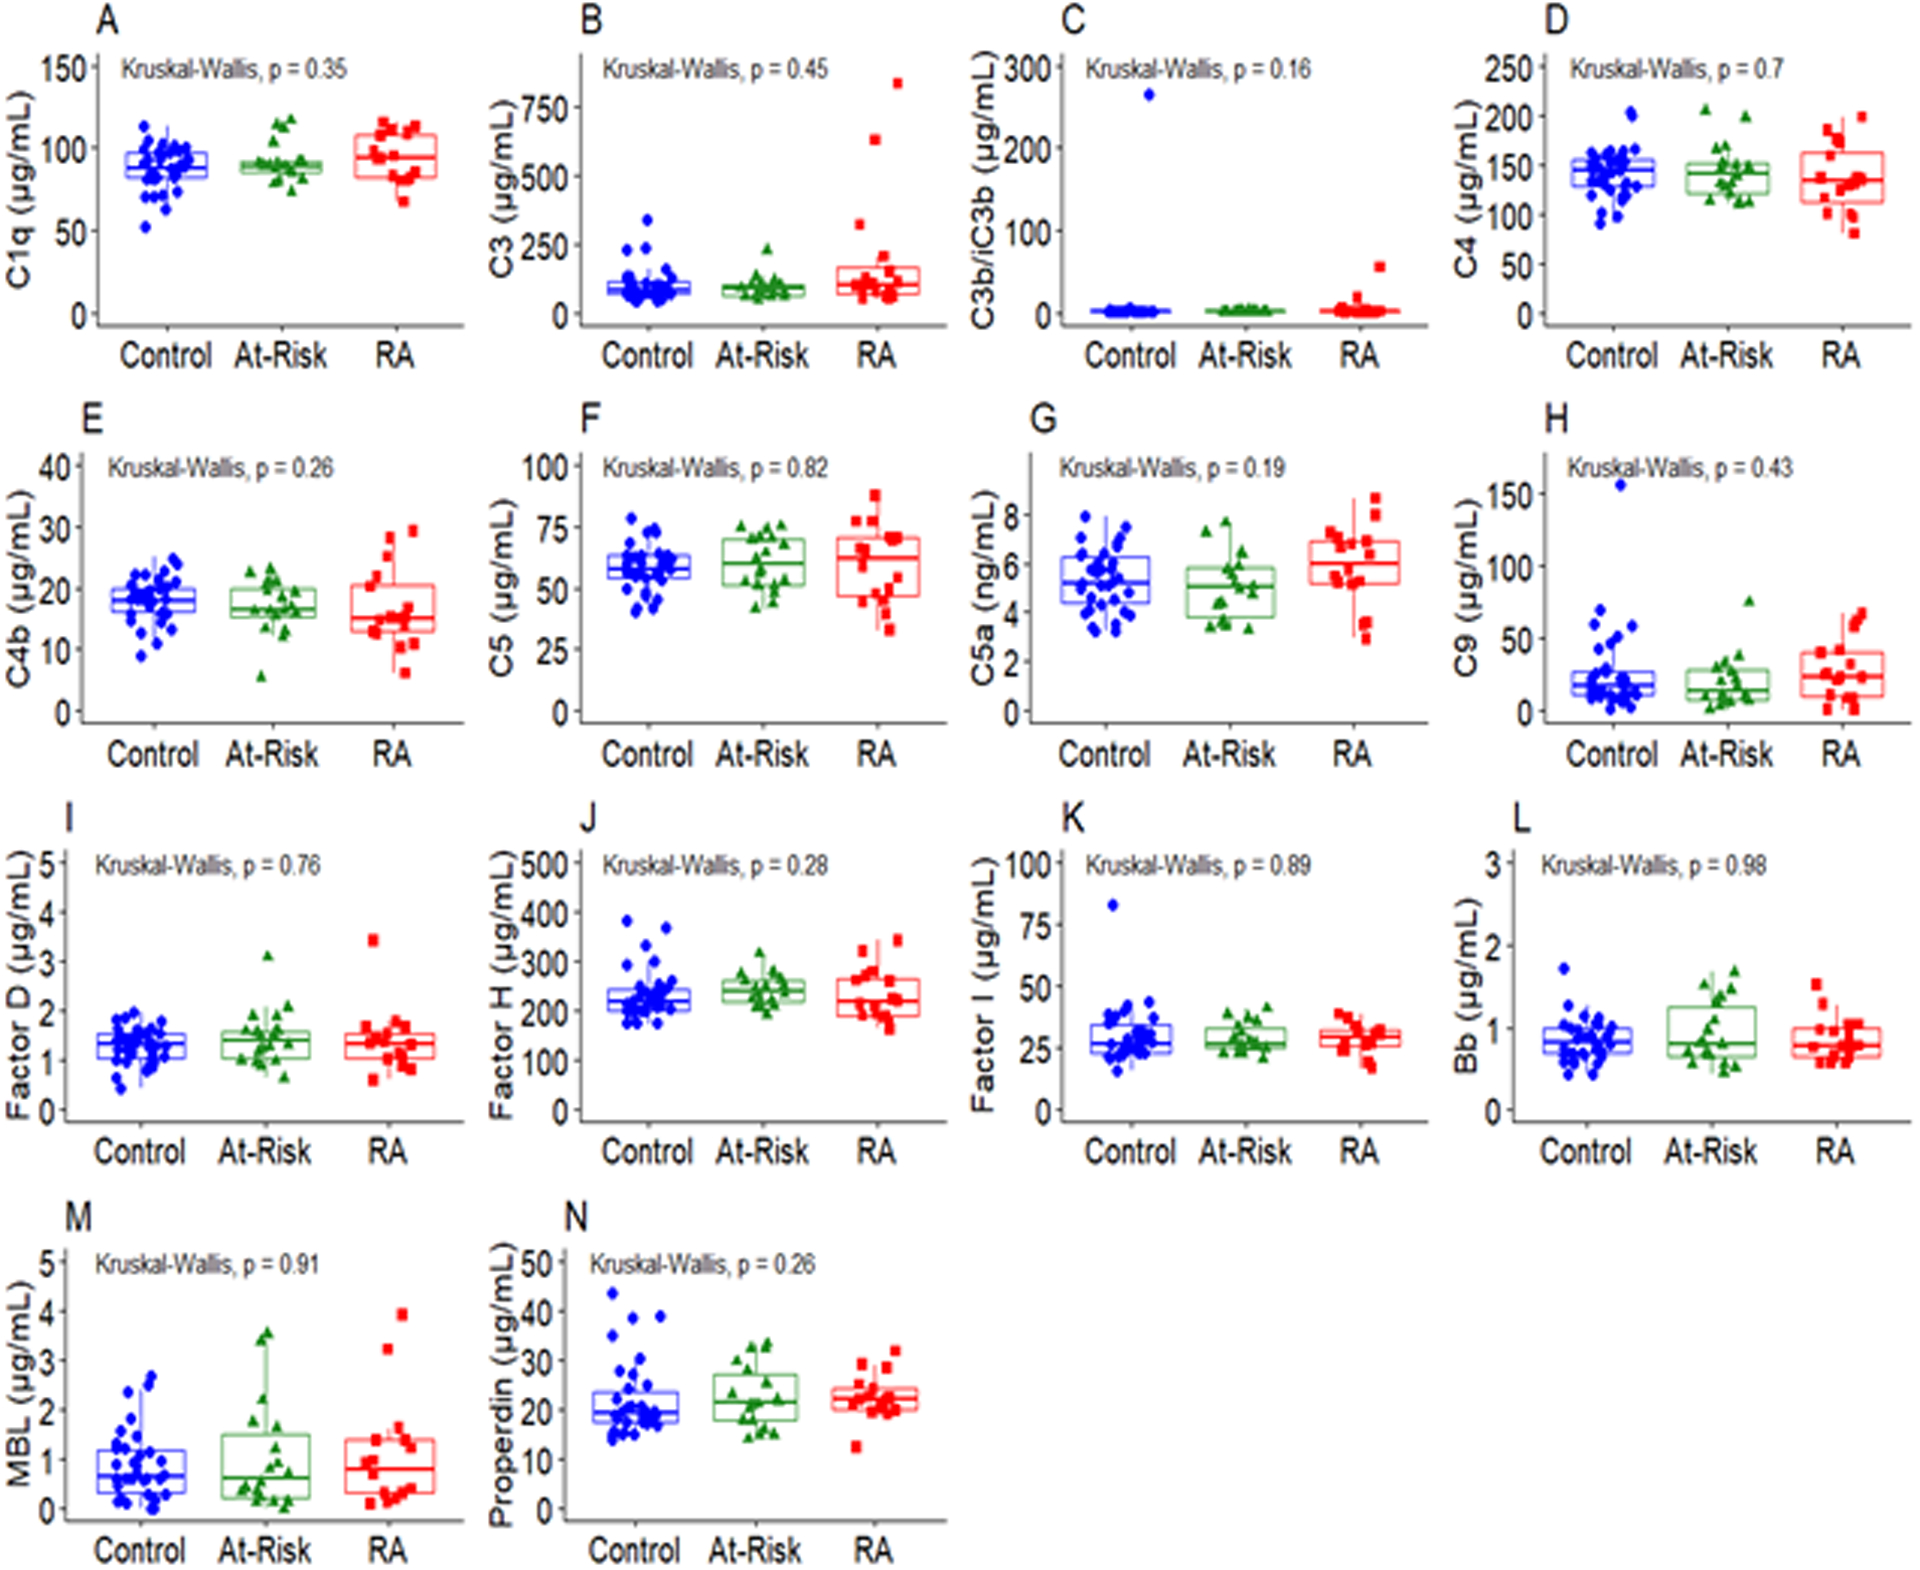
Complement whose levels did not differ among RA patients, at-risk subjects, and control subjects. The middle line indicates the median value with the upper and lower hinges corresponding to the first and third quartiles respectively. P-value from Kruskal-Wallis test shown on plots.