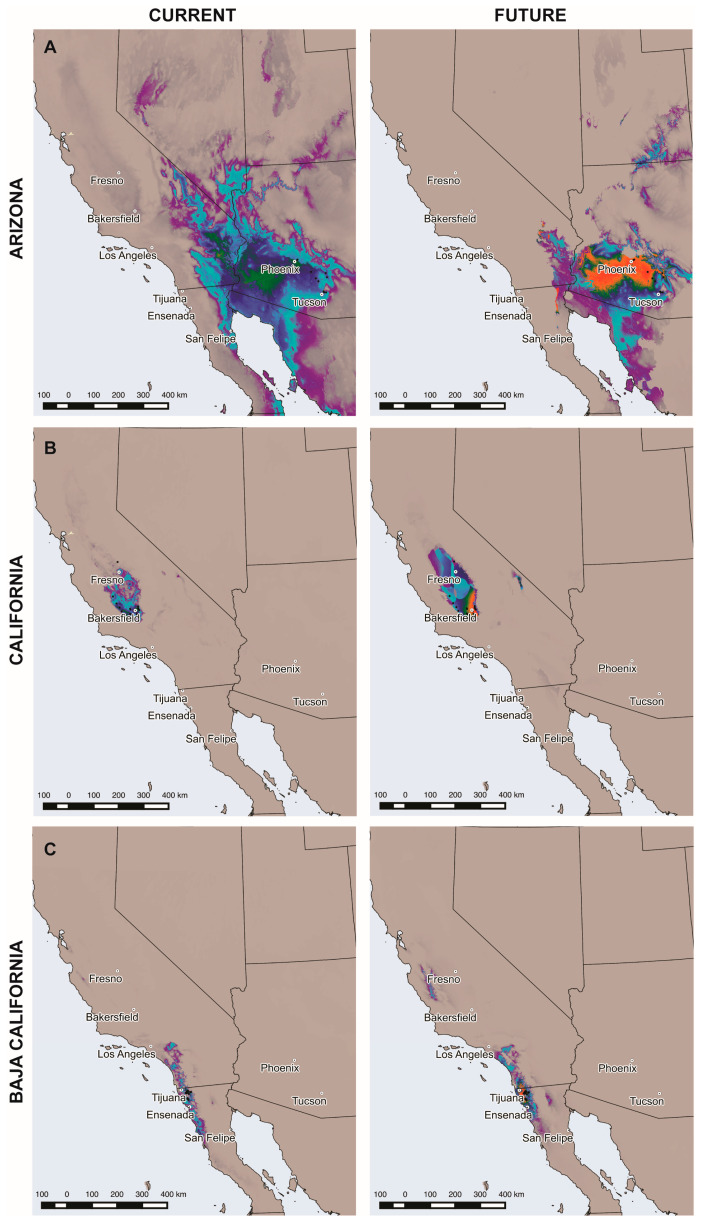
Figure 1.
Distribution models for Coccidioides spp. Current environmental variables (left), and those projected for 2070 based on a Representative concentration pathway 8.5 (right), were used to model Coccidioides spp. distribution, taking into account occurrence points in Arizona (A), in California (B) and in Baja California (C). Habitat suitability for Coccidioides spp. is represented in 10 categories based on probability: from 0 to 0.09 (gray), from 0.1 to 0.19 (dark grey), from 0.2 to 0.29 (purple), from 0.3 to 0.39 (turquoise), from 0.4 to 0.49 (dark turquoise), from 0.5 to 0.59 (blue), from 0.6 to 0.69 (dark blue), from 0.7 to 0.79 (green), from 0.8 to 0.89 (orange) and from 0.9 to 1 (red). Black dots represent points where Coccidioides spp. has been either identified molecularly or isolated from soil samples.

