Fig. 1.
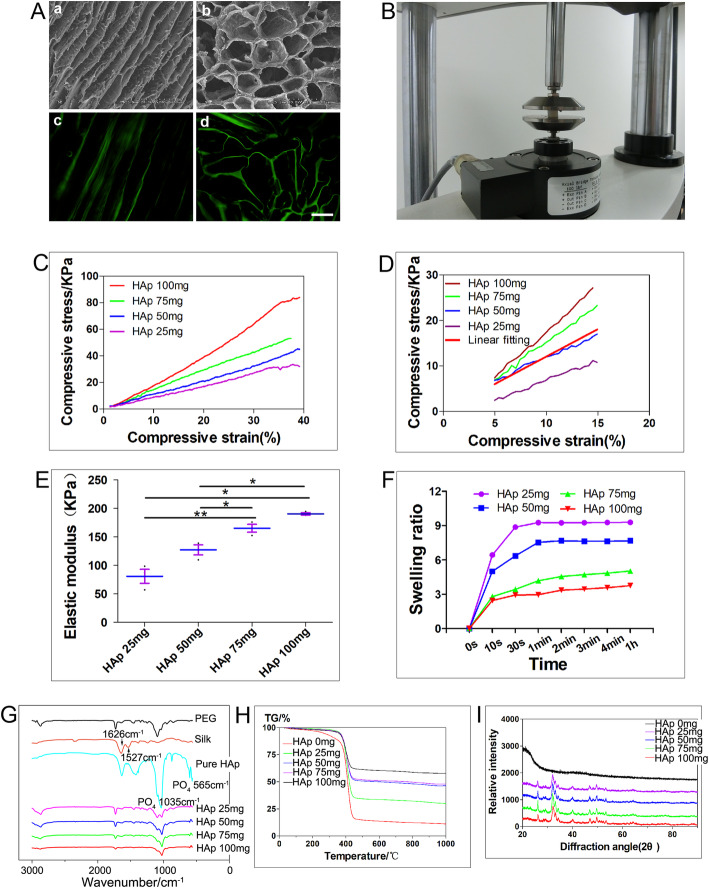
Physical properties of PEG/SF/HAp scaffolds. A SEM images (a and b) and FITC staining images (c and d) of the scaffolds prepared by unidirectional freezing. (a and c) Longitudinal sections parallel to the freezing direction. (b and d) Cross-sections perpendicular to the freezing direction (scale bar = 200 μm). B Diagram showing compression using a dynamic mechanical analyzer (DMA). C Original stress-strain curves of the scaffold. D Stress-strain curves (colorful) and fitted straight lines (red, just display one) from 5 to 15% strain. E Young’s modulus of the scaffolds with different concentration of hydroxyapatite (HAp). F Swelling kinetics of the scaffolds prepared with different proportions of HAp. G Fourier-transform infrared (FTIR) spectra of pure PEG, silk fibroin (SF), hydroxyapatite (HAp), and PEG/SF/HAp scaffolds (25, 50, 75, and 100 mg). H Thermogravimetric analysis (TGA) curve comparisons of PEG/SF/HAp scaffolds with different proportions of HAp. I X-ray diffraction (XRD) analysis of PEG/SF/HAp scaffolds

