
Figure 3:
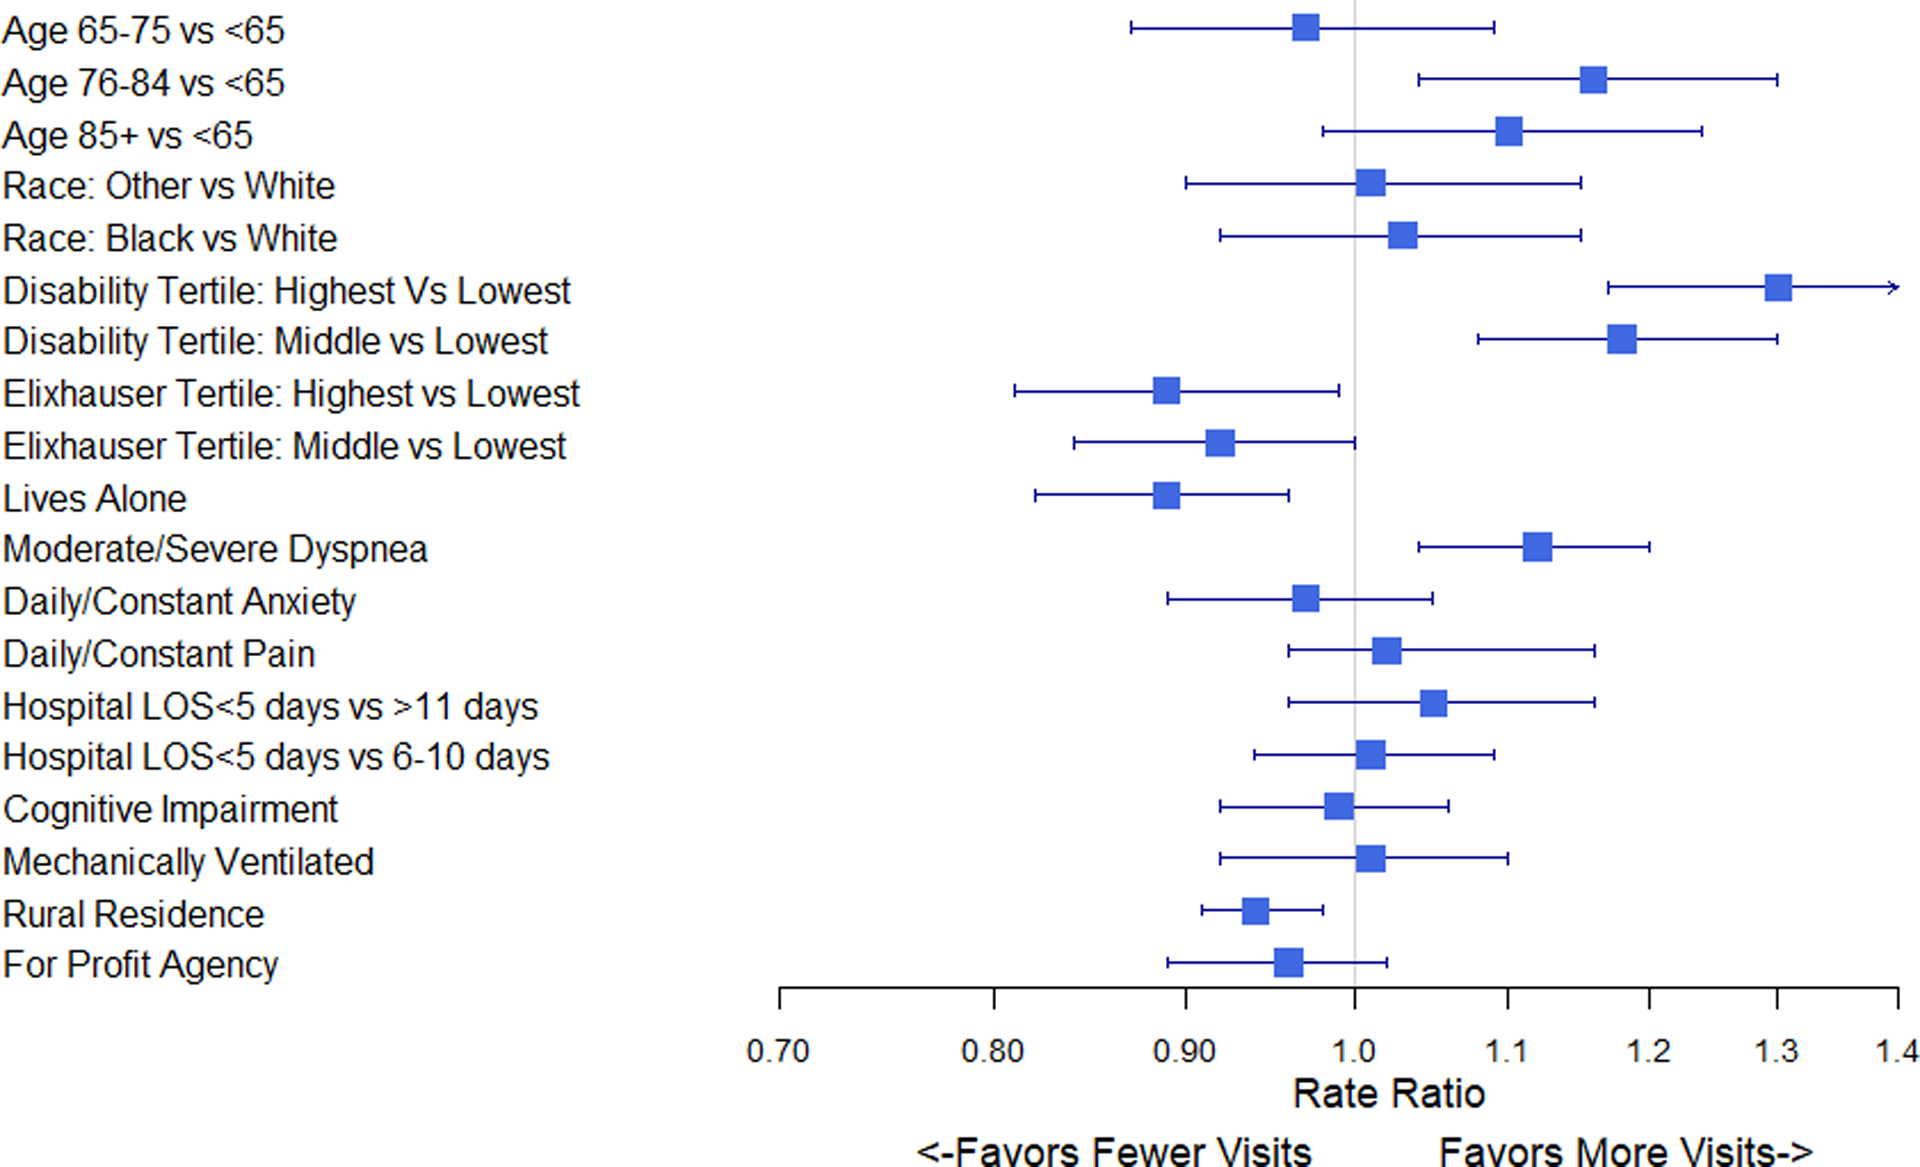
Adjusted negative binomial regression results presented as rate ratios (RRs) for the impact of each variable on rehabilitation utilization. RRs greater than 1 indicate a positive impact on number of rehabilitation visits received, and RRs less than 1 indicate a negative impact. Model was adjusted for all figure variables, and additionally for Census Bureau region and county-level count of home health agencies per 100,000 population.