
Figure 3. Anti-CRISPRs more closely mimic bound dsDNA than idealized B-DNA.
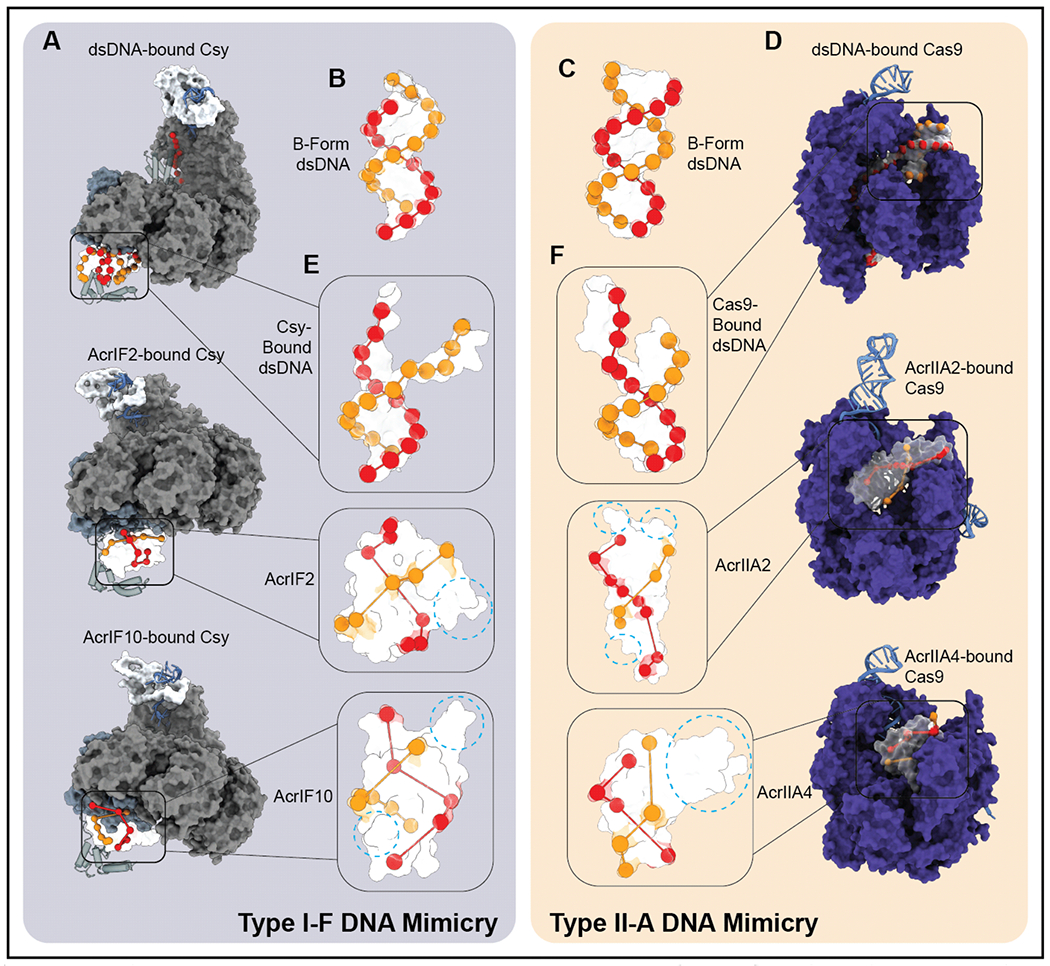
A) Surface representation of Csy bound to dsDNA, AcrIF2, and AcrIF10 (PDB: 6NE0, 5UZ9, 6B48). B-C) Surface representation of modeled B-form DNA with orbs highlighting phosphate groups of DNA backbone. D) Surface representation of Cas9 bound to dsDNA, AcrIIA2, and IIA4 (PDB: 4UN3, 6MCB, 5VW1). E-F) Surface representation of DNA bound by surveillance complex with orbs highlighting phosphate groups of DNA backbone (top) and surface representations of bound anti-CRISPRs with orbs highlighting pseudo-helical arrangement of acidic residues and auxiliary structural features (dashed blue circles in bottom two insets).