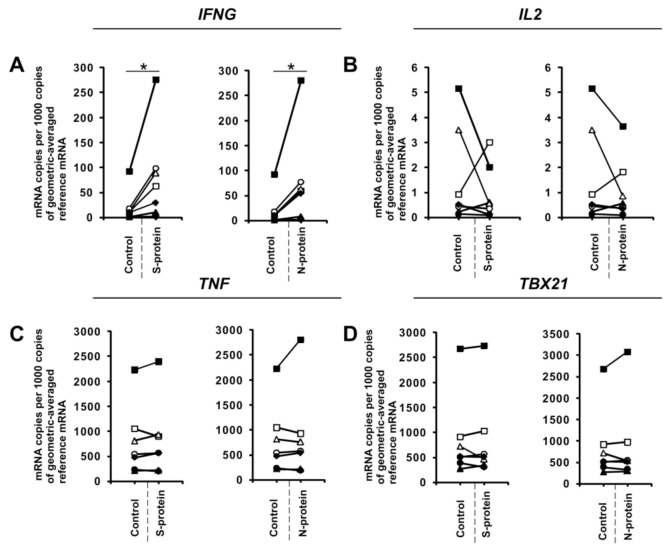
Figure 4.
SARS-CoV-2-specific gene expression in fully differentiated Th1 cells. CD4+ cells were differentiated towards Th1 lymphocytes for 5 days, restimulated with anti-CD3 and anti-CD28 beads, and then activated with 1 μg/mL SARS-CoV-2 proteins S (spike) and N (nucleocapsid) for 24 h. mRNA expression of IFNG (A), IL2 (B), TNF (C), and TBX21 (D) genes in Th1 cells. Data show individual values for seven independent donors (n = 7). “Control” denotes cells cultured in the absence of SARS-CoV-2 proteins for 24 h, and “S-protein” or “N-protein” denotes cells cultured in the presence of SARS-CoV-2 protein (S or N, respectively) for 24 h. Control values are the same for both conditions (S and N proteins). Straight lines connecting two points (control and given protein) identify samples from a specific donor. An asterisk indicates a statistically significant difference at p < 0.05. Statistical analysis was performed using Friedman repeated measures ANOVA on ranks followed by Student–Newman–Keuls post hoc test.

