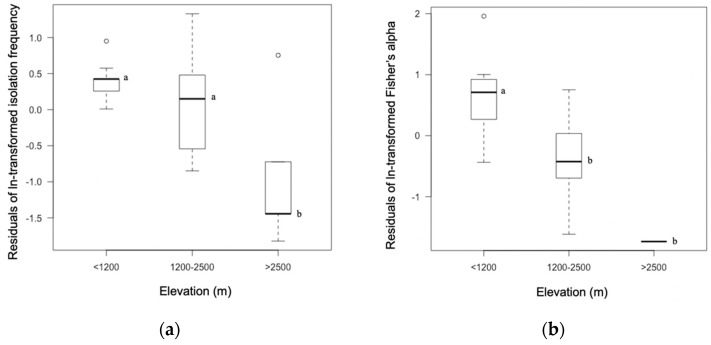
Figure 2.
Isolation frequency and diversity differed as a function of elevation. (a) Isolation frequency. (b) Diversity. Residuals of ln-transformed isolation frequency or Fisher’s alpha were used to exclude the effect of host family. Tukey’s HSD test was used for the post hoc pairwise comparison. Lowercase letters in each graph indicate the significant differences tested by Tukey’s HSD test. Cycles are outliers.

