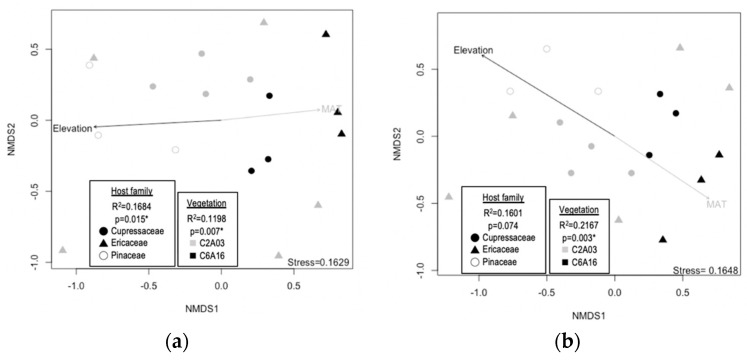
Figure 3.
NMDS visualization of community structure using the Taipingshan data set. (a) Jaccard and (b) Morisita–Horn index of dissimilarity was calculated for the analyses, respectively. Each spot represents the endophyte community structure in a sample tree. The colors represent the vegetation types coded in Li et al. [21] (C2A03: Chamaecyparis montane mixed cloud forest; C6A16: Zelkova–Quercus rock-outcrop forest). Asterisks indicate the significance of PERMANOVA tests. Arrows indicate the significant relationships of elevation (Jaccard index: R2 = 0.5914, p = 0.004; Morisita–Horn index: R2 = 0.6384, p = 0.002), mean annual temperature (MAT; Jaccard index: R2 = 0.6255, p = 0.001; Morisita–Horn index: R2 = 0.6827, p = 0.001), and annual precipitation (Jaccard: R2 = 0.7038, p = 0.001; Morisita–Horn: R2 = 0.7625, p = 0.02) with the community structure. The annual precipitation vector is not shown due to overlap with elevation.

