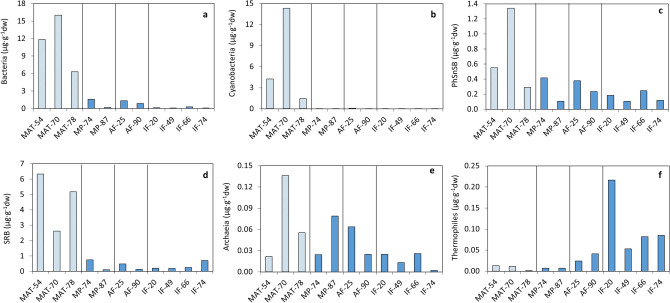
Figure 2.
Relative contribution of microbial input sources to the samples biomass in the four hydrothermal regimes, inferred from the presence (µg·g−1 of dry weight) of lipid biomarkers of (a) bacteria (sum of n-fatty acids from 16:0 to 18:0;58); (b) cyanobacteria (sum of n-heptadecane, isomeric n-heptadecenes, and monomethylalkanes of C17, C18 and C1959–62; diploptene63; and 16:1ω7, 18:2ω6, and 18:3ω6 fatty acids62,64,65); (c) photosynthetic sulfur and non-sulfur bacteria or PhSnSB (sum of the n-alkanols C16, C17, and C1866); (d) sulfate-reducing bacteria or SRB (sum of phytane67; i/a-pairs of 15:0, 17:0, and 15:1 fatty acids35; and 16:1ω5, 17:1, and 18:1ω5 fatty acids35,68,69); (e) archaea (squalane70,71); and (f) thermophiles (sum of dicarboxylic acids;72). See Text S1 for details on the uses and limitations of the approach.

