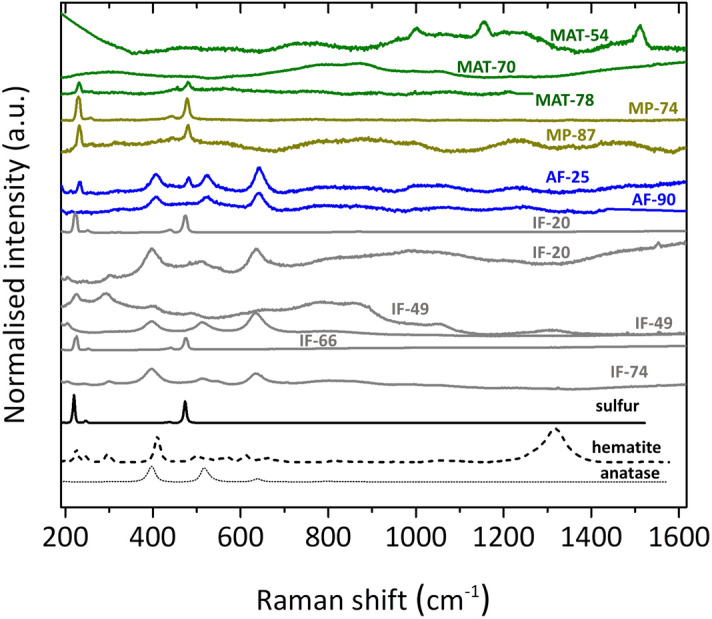
Figure 5.

Raman spectra of the minerals identified in the Icelandic hydrothermal regimes; hot spring biofilms (MATs; green), mud pots (MPs; brown), active fumaroles (AFs; blue), and inactive fumaroles (IFs; grey). At the bottom, Raman spectra of minerals from the RRUFF database are shown in black for comparison and initial mineral identification. The spectrum of MAT-54 corresponds to carotenoids, according to Gall et al.73. Different Raman spectra profiles depending on the spot measured in IF-20 and IF-49 are caused by mineral heterogeneities.
