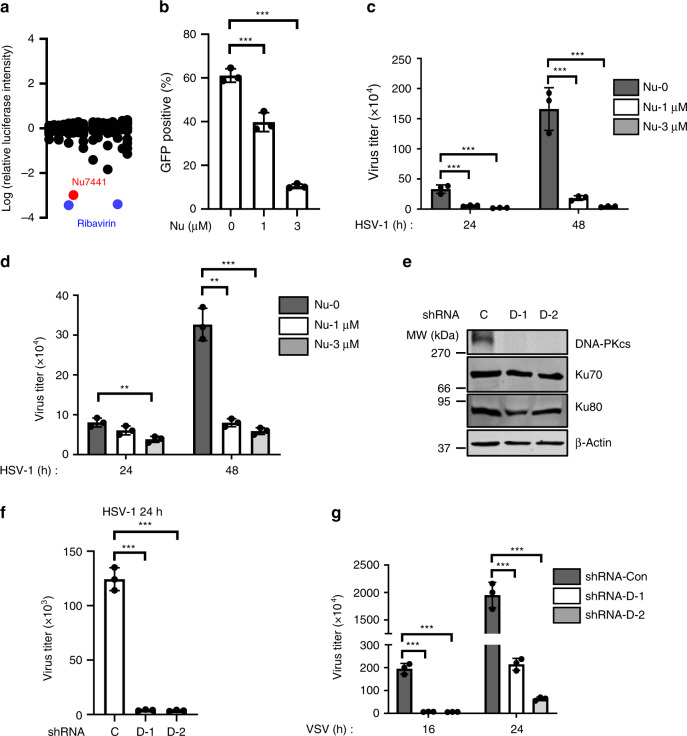
Fig. 1. DNA-PK inhibition suppresses VSV and HSV-1 replication.
a THP-1 cells were treated with ~150 compounds (10 μM) and infected with VSV-luciferase (MOI = 0.01). Luciferase activity was measured 16 h post-infection and the values were normalized to solvent control. b THP-1 cells were treated with Nu7441 and infected with VSV-GFP (MOI = 0.01). GFP-positive cell percentage was quantified by flow cytometry at 16 h post-infection. p = 0.0022 (Nu = 1 μM); p = 1 × 10⁻⁵ (Nu = 3 μM). c, d THP-1 or HFF cells were treated with Nu7441 and infected with HSV-1 (MOI = 0.01). Viral titer in the medium at the indicated time points was determined by plaque assays. c HSV-1 (24 h): p = 0.0025 (Nu = 1 μM), p = 0.0015 (Nu = 3 μM); HSV-1 (48 h): p = 0.0020 (Nu = 1 μM), p = 0.0014 (Nu = 3 μM). d HSV-1 (24 h): p = 0.0054 (Nu = 3 μM); HSV-1 (48 h): p = 0.0005 (Nu = 1 μM), p = 0.0004 (Nu = 3 μM). e THP-1 cells infected with control (C) or DNA-PKcs (D-1, D-2) shRNA lentivirus were selected with puromycin, and whole-cell lysates (WCLs) were analyzed by immunoblotting with the indicated antibodies. f, g THP-1 stable cells as described in e were infected with HSV-1 (f) or VSV (g) (MOI = 0.01). Viral titer in the medium at the indicated time points was determined by plaque assays. f p = 4 × 10⁻⁵ (D-1), p = 4 × 10⁻⁵ (D-2); g VSV (16 h): p = 0.0002 (D-1), p = 0.0002 (D-2); VSV (24 h): p = 0.0002 (D-1), p = 0.0002 (D-2). All experiments were done at least twice, and one representative is shown. n = 3 biologically independent samples for b–d, f, g. Data are presented as mean values ± SD. **p < 0.01, ***p < 0.005, two-tailed Student’s t test. Source data are provided as a Source data file.

