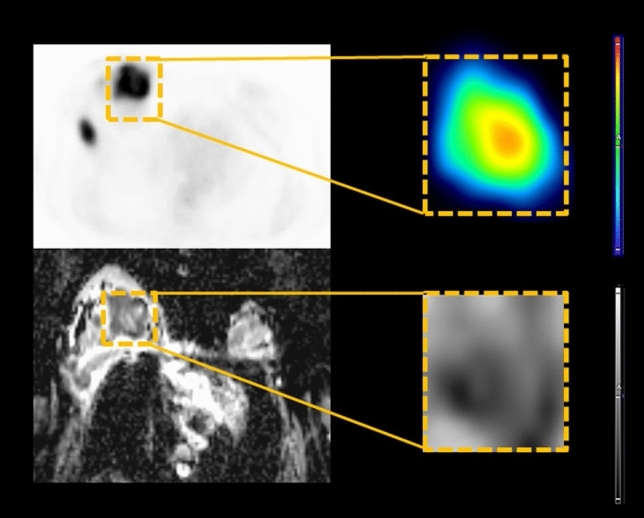
Figure 1.

Diagram of image cropping for deep learning technique. The cubic shaped region-of-interest was selected at the largest cross-sectional area of the lesion and resized to 64 × 64 pixels. 18F-fluorodeoxyglucose (FDG) and apparent diffusion coefficient (ADC) images were obtained from positron emission tomography/computed tomography (PET/CT) and magnetic resonance imaging (MRI) scans, respectively. Baseline images were defined as PET0 and ADC0, respectively, and interim images were defined as PET1 and ADC1, respectively.
