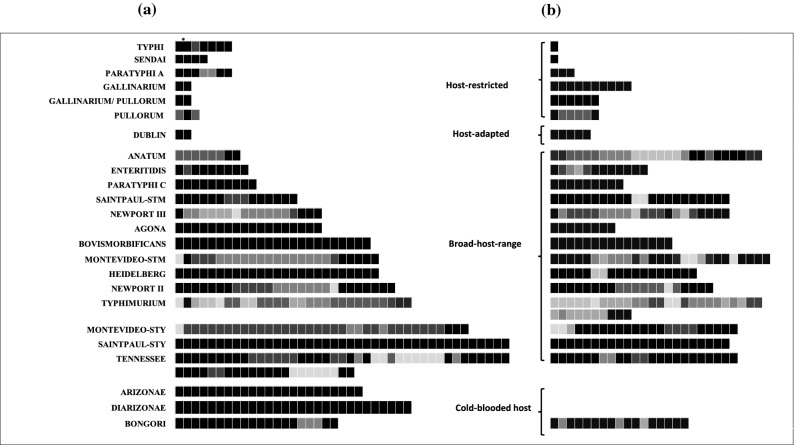
Figure 1.
Graphic map of spacer conservation in CRISPR1 (a) and CRISPR2 (b) array for Salmonella serovars. The shades of grey represent the conservation percentage of a given spacer in all the strains of the respective serovar where, the darker box indicate the presence of spacer in most of the strains (black: 100%) while, the lighter box indicate the presence of spacer in a few strains. *Indicates merging of two spacers in a few strains of serovar Typhi.

